---
title: SystemView Release Notes v1.2609.1 (September/October 2026)
description: "SystemView v1.2609.1: corrected midnight census counts, reliable Surgery Forecasting Tool filters, plus fixes across Beds, Interact and JurisdictionView."
---
[Skip to content](https://academy.healthcarelogic.com/knowledge/systemview-release-notes-v1.2609.1-september/october#main-content)
[Contact Us](https://academy.healthcarelogic.com/knowledge/kb-tickets/new)
[](https://academy.healthcarelogic.com/knowledge)
- [Getting Started](https://academy.healthcarelogic.com/getting-started-with-systemview)
- [Domain Overviews](https://academy.healthcarelogic.com/learning-hub/domain-overviews)
- [On-demand Learning](https://academy.healthcarelogic.com/learning-hub/webinars/australia/on-demand-webinars)
- [Webinars](https://academy.healthcarelogic.com/learning-hub/webinars)
Open main navigation
Close main navigation
- [Getting Started](https://academy.healthcarelogic.com/getting-started-with-systemview)
- [Domain Overviews](https://academy.healthcarelogic.com/learning-hub/domain-overviews)
- [On-demand Learning](https://academy.healthcarelogic.com/learning-hub/webinars/australia/on-demand-webinars)
- [Webinars](https://academy.healthcarelogic.com/learning-hub/webinars)
- [Contact Us](https://academy.healthcarelogic.com/knowledge/kb-tickets/new)
- [Contact Us](https://info.healthcarelogic.com/contact-us)
[Contact Us](https://info.healthcarelogic.com/contact-us)
Search the Knowledge Base
- There are no suggestions because the search field is empty.
1. [SystemView Knowledge Base](https://academy.healthcarelogic.com/knowledge)
2. [Release Notes](https://academy.healthcarelogic.com/knowledge/release-notes)
September 24, 2026
# SystemView Release Notes v1.2609.1 (September/October 2026)
## More reliable filters, restored patient details, and a new way to analyse outpatient cancellations in SystemView.
This release corrects the midnight census count in Beds, so some wards and dates may show lower occupancy than before, including in past months. It also fixes the filters in the Surgery Forecasting Tool and issues across Beds, Outpatients, Interact and JurisdictionView.
***Some items depend on your health service's deployment and configuration. If you're unsure whether they apply to your site, you can always check with us at customersuccess@healthcarelogic.com.***
### More accurate midnight census counts
The Occupancy by Date (Midnight Census) chart now counts each patient once per ward at each midnight census. Some patients were counted more than once. This happened when one stay had more than one episode number in the source data, for example after a move between wards or care types.
The historical patient list you open from the chart has the same fix. It shows each patient once, so it now matches the chart.
If you compare with earlier reports, some wards and dates may show fewer occupied beds and lower occupancy, including in past months.
**Where to find it:** Beds \> LoS Trends & Ward Dynamics
**Learn more:** [Length of Stay (LoS) Trends & Ward Dynamics on the Knowledge Base](https://academy.healthcarelogic.com/knowledge/beds-los-trends-and-ward-dynamics)
### Surgery Forecasting Tool filters load reliably
When you add a strategy in the Surgery Forecasting Tool, the Facility list now shows only facilities in the district chosen at the top of the screen. Choosing a facility from another district stopped the Procedure Type and Specialty filters from loading. Both filters now load as expected.
To see a strategy you set up earlier for a facility in another district, select that district at the top of the screen. Availability depends on your deployment.
**Where to find it:** Surgery \> Surgery Forecasting Tool
### Match the Area filter to the Patient Flow chart
We can now set the Area filter on the Emergency Department Situation Report to follow the order of the Emergency Department Patient Flow chart. The filter and the chart then read the same way. The order comes from your site's area mapping. If you'd like this for your site, contact us.
**Where to find it:** Emergency Department \> Department Now \> Situation Report
**Learn more:** [Department Now \> Situation Report on the Knowledge Base](https://academy.healthcarelogic.com/knowledge/ed-department-now-situation-report)
### Fixes in this release
| Area | What's fixed |
| --- | --- |
| Beds \> Complex Patients \> Admitted Patient Register | Patient names now show for every facility, for users with access to identifiable data. At one facility they were missing because its patient details weren't being loaded. |
| Beds | For patients whose care type changed during their stay (SNAP), admission and discharge details on earlier episodes of care now update correctly. They now match the source system. |
| Patient Cohorts \> Beds \> Current Patients & Recent Trends | The Current Patient Cohort List loads much faster, including when All Facilities is selected. Before, it could time out. |
| Surgery | At one site, a specialty that showed twice because of a spelling difference in the source data now shows once in filters and reports. |
| Interact | A chart that uses a facility you don't have access to now says “You do not have access to the selected Facility”. Before, it showed an incorrect message. |
| Interact \> MyReports | In generated reports, a chart with no data now says “No data available based on current filter selections”, as it does in MyHub. It used to say “Bad Request”. The Grouping column in the Outpatient Demand and Capacity Analysis and Risk Groups by Specialty table also displays properly. |
| JurisdictionView \> Scorecard | The Monthly Scorecard's All Facilities view now shows data when some facilities in a district have all key metrics switched off. Before, it could show no data at all. |
| Mapping Tables \> Data Mapping Interface | Publishing ward mapping changes no longer fails when a new ward has been added automatically under the default mappings. |
### Did you know? Compare hospital and patient cancellations
In Clinic Effectiveness \> Cancellations, you can use the Cancellation Type and Cancellation Date filters together. Cancellation Type shows who cancelled: the patient or the hospital. Cancellation Date groups cancellations by how far ahead of the appointment they were made.

**Try this:** Set Cancellation Type to Patient, then pick a Cancellation Date option to focus on short-notice cancellations. In the Patient List, the Cancellation days notice column shows how many days before the appointment each one was cancelled.
**Why it's useful:**
- Separate hospital changes, such as a clinician being unavailable or a clinic being rescheduled, from the barriers that stop patients attending.
- Find repeat patterns in short-notice patient cancellations by specialty, clinic or doctor, and spot appointment time you could fill.
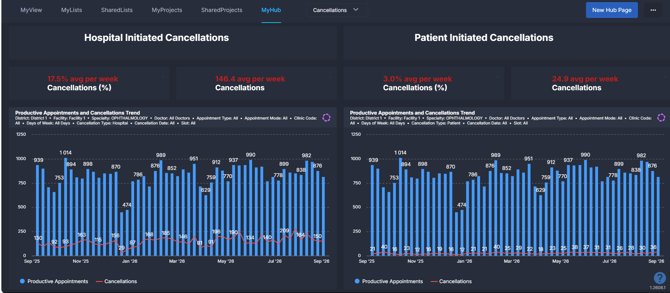
**Pro tip:** Put a hospital view and a patient view side by side on a MyHub page to watch both trends in one place.
**Where to find it:** Outpatients \> Clinic Effectiveness \> Cancellations. Availability depends on your deployment.
**Learn more:** [Clinic Effectiveness \> Cancellations on the Knowledge Base](https://academy.healthcarelogic.com/knowledge/outpatients-clinic-effectiveness-cancellations)
### Keep learning
**[Learning Hub](https://academy.healthcarelogic.com/learning-hub):** Walkthroughs, domain overviews and guided resources.
**[Webinars](https://academy.healthcarelogic.com/learning-hub/webinars/australia):** Live sessions and on-demand recordings on key features and domains.
**Questions or feedback?** Contact us at customersuccess@healthcarelogic.com.
- [Getting Started](https://academy.healthcarelogic.com/knowledge/getting-started#main-content)
- [Welcome & Introduction](https://academy.healthcarelogic.com/knowledge/getting-started#welcome-introduction)
- [Access & Account Setup](https://academy.healthcarelogic.com/knowledge/getting-started#access-account-setup)
- [Basic Navigation & Layout](https://academy.healthcarelogic.com/knowledge/getting-started#basic-navigation-layout)
- [FAQs & Troubleshooting](https://academy.healthcarelogic.com/knowledge/getting-started#faqs-troubleshooting)
- [Interact](https://academy.healthcarelogic.com/knowledge/interact#main-content)
- [Interact Basics](https://academy.healthcarelogic.com/knowledge/interact#interact-basics)
- [Customising SystemView](https://academy.healthcarelogic.com/knowledge/interact#customising-systemview)
- [Sharing & Duplicating Content](https://academy.healthcarelogic.com/knowledge/interact#sharing-duplicating-content)
- [Using Notifications & Improvement Tools](https://academy.healthcarelogic.com/knowledge/interact#using-notifications-improvement-tools)
- [Surgery](https://academy.healthcarelogic.com/knowledge/surgery#main-content)
- [Introduction & Terminology](https://academy.healthcarelogic.com/knowledge/surgery#introduction-terminology)
- [Waiting List Management](https://academy.healthcarelogic.com/knowledge/surgery#waiting-list-management)
- [Scheduling & Booking Management](https://academy.healthcarelogic.com/knowledge/surgery#scheduling-booking-management)
- [Performance & Activity Analysis](https://academy.healthcarelogic.com/knowledge/surgery#performance-activity-analysis)
- [Emergency Surgery](https://academy.healthcarelogic.com/knowledge/surgery#emergency-surgery)
- [FAQs & Troubleshooting](https://academy.healthcarelogic.com/knowledge/surgery#faqs-troubleshooting)
- [Outpatients](https://academy.healthcarelogic.com/knowledge/outpatients#main-content)
- [Introduction & Terminology](https://academy.healthcarelogic.com/knowledge/outpatients#introduction-terminology)
- [Waiting List Management](https://academy.healthcarelogic.com/knowledge/outpatients#waiting-list-management)
- [Referral Management](https://academy.healthcarelogic.com/knowledge/outpatients#referral-management)
- [Wait Times](https://academy.healthcarelogic.com/knowledge/outpatients#wait-times)
- [Demand & Capacity Planning](https://academy.healthcarelogic.com/knowledge/outpatients#demand-capacity-planning)
- [Bookings & Reviews](https://academy.healthcarelogic.com/knowledge/outpatients#bookings-reviews)
- [Clinic Effectiveness & Appointment Outcomes](https://academy.healthcarelogic.com/knowledge/outpatients#clinic-effectiveness-appointment-outcomes)
- [Virtual Learning & Tools](https://academy.healthcarelogic.com/knowledge/outpatients#virtual-learning-tools)
- [Beds](https://academy.healthcarelogic.com/knowledge/beds#main-content)
- [Introduction & Foundations](https://academy.healthcarelogic.com/knowledge/beds#introduction-foundations)
- [Inpatient Demand & Capacity](https://academy.healthcarelogic.com/knowledge/beds#inpatient-demand-capacity)
- [Complex Patients Management](https://academy.healthcarelogic.com/knowledge/beds#complex-patients-management)
- [Risk of Hospitalisation & Readmissions](https://academy.healthcarelogic.com/knowledge/beds#risk-of-hospitalisation-readmissions)
- [Length of Stay & Inpatient Flow](https://academy.healthcarelogic.com/knowledge/beds#length-of-stay-inpatient-flow)
- [Inpatient Occupancy Forecaster](https://academy.healthcarelogic.com/knowledge/beds#inpatient-occupancy-forecaster)
- [Emergency Department](https://academy.healthcarelogic.com/knowledge/emergency-department#main-content)
- [Introduction & Foundations](https://academy.healthcarelogic.com/knowledge/emergency-department#introduction-foundations)
- [Department Now](https://academy.healthcarelogic.com/knowledge/emergency-department#department-now)
- [Flow Monitor](https://academy.healthcarelogic.com/knowledge/emergency-department#flow-monitor)
- [Performance Trends & Analytics](https://academy.healthcarelogic.com/knowledge/emergency-department#performance-trends-analytics)
- [Virtual Learning & Tools](https://academy.healthcarelogic.com/knowledge/emergency-department#virtual-learning-tools)
- [FAQs & Troubleshooting](https://academy.healthcarelogic.com/knowledge/emergency-department#faqs-troubleshooting)
- [SystemView 2](https://academy.healthcarelogic.com/knowledge/systemview-2)
- [System Administration](https://academy.healthcarelogic.com/knowledge/system-administration)
- [Patient Cohorts](https://academy.healthcarelogic.com/knowledge/patient-cohorts#main-content)
- [Beds](https://academy.healthcarelogic.com/knowledge/patient-cohorts#beds)
- [Emergency Department](https://academy.healthcarelogic.com/knowledge/patient-cohorts#emergency-department)
- [Release Notes](https://academy.healthcarelogic.com/knowledge/release-notes)
[](https://healthcarelogic.com/)
[mailto:customersuccess@healthcarelogic.com](mailto:customersuccess@healthcarelogic.com)
© 2026 HealthCare Logic. All rights reserved
**Didn't find what you were looking for?**
[Raise a support ticket](https://academy.healthcarelogic.com/knowledge/kb-tickets/new) and our team will come back to you. For guided training try the [Learning Hub](https://academy.healthcarelogic.com/learning-hub), or catch up on a [past webinar](https://academy.healthcarelogic.com/learning-hub/webinars).