
Location in SystemView: SystemView > Explore > Beds > Inpatient Occupancy Forecaster > Hourly Forecast
In this article:
What it is
The Hourly Forecast predicts inpatient bed occupancy for each hour of the next 12, 24, 48 or 72 hours, and shows the last 12 hours of actual occupancy for context. It compares forecast occupancy with Open and Available Beds, so you can see when and where demand is expected to exceed the beds you have.
It also shows today’s admissions and discharges against what is expected for a typical day, so you can see what is driving the current position.
The Hourly Forecast sits alongside the Daily Forecast, which shows forecast occupancy at midnight for the coming days.
Why it matters
See when bed pressure is expected to occur, not just which day it may occur.
Bed demand can change considerably within a single day. The Hourly Forecast provides more detailed visibility of these changes, helping teams anticipate periods where admissions may outpace discharges or available bed capacity may become constrained.
- Identify forecast occupancy peaks across wards and divisions.
- See when admission demand and discharge activity may create capacity pressure.
- Compare forecast occupancy with open and available bed capacity.
- Support coordination of patient flow across wards and services before forecast pressure develops.
How to use it
Filter to focus your view

Use filters to narrow your forecast to a specific hospital, division, or ward:
- Facility: Select the facility to include in the forecast.
- Division: Focus the forecast on one or more hospital divisions.
- Ward Group: Fixed to Main Wards only.
- Ward Type and Name: Select one or more from the Facility and Division(s) selected (Main Wards only).
- Stay Type: Filter by stay type, such as Overnight or Day Stay.
- Forecast Horizon / Hours: Select how far ahead to view the hourly forecast, such as 12, 24, 48 or 72 hours.
- Current Patient Details: Current inpatients, with their Predicted Discharge Date, Estimated Total LoS and days until estimated discharge, sorted by Estimated Total LoS.
- Show Elective Surgery Patients: Booked elective admissions that have not yet arrived, including day stay patients.
Two buttons above the tiles open patient lists for the current filter selection:
Tip: Start with the 12 hour view for today’s bed meeting, then switch to 48 or 72 hours to see whether pressure carries into tomorrow.
Monitor hourly occupancy and capacity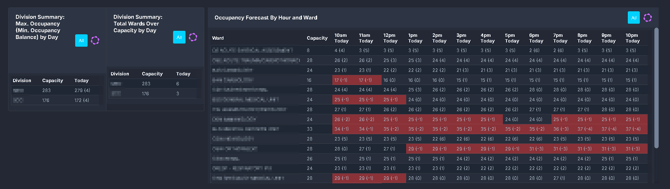
|
Tile / Chart Name |
What it shows |
|
Occupancy Forecast Metrics |
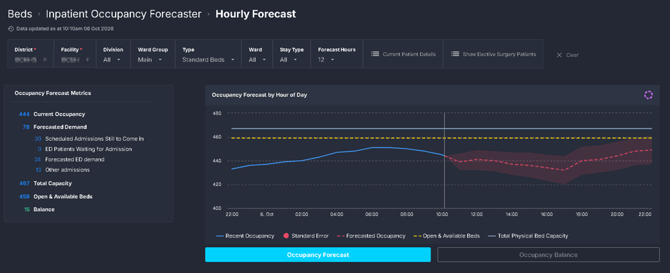
A summary of the current position: Current Occupancy, Forecasted Demand (broken down into Scheduled Admissions Still to Come In, ED Patients Waiting for Admission, Forecasted ED Demand and Other Admissions), Total Capacity, Open and Available Beds, and Balance. Balance is shown in green when positive and red when negative. |
|
Occupancy Forecast by Hour of Day |
Recent occupancy for the last 12 hours, then forecast occupancy for each hour ahead with a shaded standard error range. A dotted vertical line marks the current time. Open and Available Beds and Total Capacity are shown as reference lines. |
|
Occupancy Balance by Hour of Day |
Select Occupancy Balance beneath the chart to switch to this view. It shows Open and Available Beds minus occupancy for each hour. Below zero means more patients than open beds. |
|
Division Summary: Max. Occupancy (Min. Occupancy Balance) by Day |
For each division and each forecast day: the highest forecast occupancy, with the lowest balance in brackets. This shows each division’s tightest point in the day. |
|
Division Summary: Total Wards Over Capacity by Day |
The number of wards forecast to exceed capacity on each day, helping identify whether predicted pressure is isolated or spread across multiple wards. |
|
Occupancy Forecast by Hour and Ward |
Each ward’s capacity, then forecast occupancy with balance in brackets for each time point. Cells with a negative balance are highlighted red. The first column shows the current position. Columns are hourly for a 12 hour forecast and every 4 hours for longer forecasts. |
|
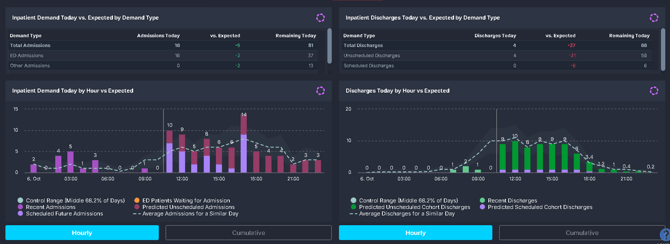
Inpatient Demand Today vs. Expected by Demand Type |
For Total Admissions, ED Admissions and Other Admissions: admissions so far today, the difference from expected, and the number expected over the rest of today (Remaining Today). |
|
Inpatient Discharges Today vs. Expected by Demand Type |
Admissions for each hour of today against the expected value and upper and lower control limits. Past hours show actual admissions; later hours show predicted unscheduled admissions and scheduled admissions. |
|
Inpatient Demand Today by Hour vs Expected |
For Total Discharges, Unscheduled Discharges and Scheduled Discharges: discharges so far today, the difference from expected, and the number expected over the rest of today. |
|
Discharges for each hour of today against the expected value and control limits. |
|
|
Cumulative Inpatient Demand Today by Hour vs Expected |
Select Cumulative beneath the demand chart to switch to this view. It shows the running total of admissions since midnight against the expected running total for a typical day. Past hours show actual admissions; later hours show predicted admissions. A dotted vertical line marks the current time. |
|
Cumulative Discharges Today by Hour vs Expected |
Select Cumulative beneath the discharges chart to switch to this view. It shows the running total of discharges since midnight against the expected running total for a typical day. Past hours show actual discharges; later hours show predicted discharges. A dotted vertical line marks the current time. |
How it works
The Hourly Forecast extends the predictive model behind the Daily Forecast so that it produces a value for every hour instead of one value at midnight. Each forecast run looks at who is in hospital now, who is expected to arrive and who is expected to leave, and estimates occupancy for each hour ahead.
The forecast draws on:
- Current inpatients, using information already held in SystemView such as current length of stay, ward, estimated date of discharge (EDD), age and previous hospital use.
- Scheduled admissions from elective waiting list and booking data.
- Emergency Department demand, including patients in ED waiting for an inpatient bed and forecast ED admissions. Using near-real-time ED data lets the forecast respond to what is happening in ED today.
- Other admissions, which are admissions that are neither scheduled nor from ED, such as admissions from outpatients, inter-hospital transfers and babies born in hospital.
- Forecast discharges, based on each patient’s predicted discharge date.
- Open and Available Beds and Total Capacity, as recorded in Bed Capacity Monitor.
No new data is collected for this component. It does not use clinical notes or new orders.
When the forecast updates: The forecast runs several times a day at scheduled times. It does not refresh every hour. The time of the latest run is shown under the page heading as Data updated as at. Each run also updates the Daily Forecast so the two stay aligned
Which wards are included: The Hourly Forecast uses the same ward inclusion rules as the Daily Forecast. It covers all main and physical inpatient wards. Hospital in the Home, virtual beds and short stay assessment unit beds are not included. Planned transfers between wards are not forecast.
SystemView is read-only. The Hourly Forecast does not write back to, change or correct any source system, bed management record or patient record.
Component logic
Forecast occupancy is the number of patients expected to be in a bed at each hour: current inpatients who are expected to still be in hospital, plus forecast admissions, minus forecast discharges.
Balance is Open and Available Beds minus forecast occupancy. A negative balance means more patients are forecast than there are open beds.
Standard error range: The shaded band shows the uncertainty around the forecast. It is wider for individual wards than for divisions or the whole facility, because smaller numbers are harder to predict.
Recent occupancy: The 12 hours before the current time show actual occupancy, so you can see how the position has been moving.
Expected values in the demand and discharge charts are the historical average for each hour over the previous 90 days, for the same filter selection. The control limits are based on the standard deviation over the same period.
What counts as a discharge depends on your filters. When you filter to wards or divisions, a discharge includes a transfer out of the wards you selected. At facility level, only discharges from hospital are counted.
Rounding: Values of 0.5 or more are rounded to whole numbers. Values below 0.5 keep their decimal, so that wards with very low admission or discharge numbers do not show as zero. This means stacked bars can add up to a decimal total.
In simple terms: SystemView looks at the patients in your hospital now, the patients booked or expected to arrive, and when each patient is likely to go home. It adds these up for every hour ahead and compares the result with your open beds. The forecast updates several times a day as patients are admitted and discharged.
How it helps you
- Anticipate intraday pressure: See which hours are forecast to experience the greatest inpatient occupancy and capacity pressure.
- Understand the balance of admissions and discharges: Identify periods where incoming demand is expected to outpace patient discharges.
- Focus on pressure points: Move from division-level summaries into ward-level forecasts and patient details where closer review is required.
- Support coordinated patient flow: Provide Bed Managers, Patient Flow Leads, Hospital Nurse Coordinators and ward teams with a shared view of expected capacity pressure.
- Connect short-term and forward planning: Use hourly forecasts alongside scheduled demand, bed capacity and length-of-stay information to understand the factors contributing to predicted occupancy.
Best practices
How often should I use it?
|
What to do |
How often |
Who typically does this |
Why it helps |
|
Review the next 24 hours of forecast occupancy and balance |
Daily or during shift planning |
Bed Managers, Patient Flow Leads, Hospital Nurse Coordinators |
Highlights intraday periods where demand and available capacity may become closely balanced. |
|
Review ward-level forecast pressure |
Daily |
Bed Managers, Ward NUMs, Flow Coordinators |
Helps identify which wards are contributing to forecast capacity pressure and when it is expected to occur. |
|
Compare forecast demand with scheduled inpatient activity |
As part of forward capacity planning |
Bed Managers, Patient Flow Leads |
Provides context on how known scheduled activity contributes to expected occupancy. |
|
Review division-level forecast summaries |
As required for capacity and flow review |
Bed Managers, Patient Flow Leads, divisional leaders |
Provides a higher-level view of forecast pressure across multiple wards and days. |
Pair with these components
- Inpatient Occupancy Forecaster > Live Inpatient Occupancy Forecast: Provides a broader daily view of forecast inpatient occupancy and capacity across the coming days.
- Inpatient Demand > Scheduled Demand: Provides more detail about upcoming scheduled admissions contributing to future inpatient demand.
- Bed Capacity Monitor: Provides visibility of current bed capacity information used to understand the relationship between forecast demand and available beds.
- LoS Trends & Ward Dynamics: Provides historical length-of-stay and ward dynamics context to complement the forward-looking occupancy forecast.
Tips for success
- Start with the shorter forecast horizon when reviewing immediate patient flow, then extend the forecast to understand how pressure develops over subsequent days.
- Review occupancy and occupancy balance together. High occupancy does not provide the full picture without considering the available capacity for that ward or division.
- Use division summaries to identify broader pressure, then move to ward-level information for more detailed analysis.
- Review forecast peaks alongside expected admissions and discharges to understand what is contributing to the predicted change in occupancy.
- Forecasts are predictive and may change as inpatient activity, scheduled admissions and source data are updated. Local capacity settings and ward configuration can also affect what is displayed.
FAQs
Q: Why can’t I see the Hourly Forecast for my hospital?
A: The Hourly Forecast is switched on for specific hospitals. If your hospital is not yet enabled, contact your SystemView administrator or HealthCare Logic Customer Success.
Q: Why are some wards missing?
A: The Hourly Forecast uses the same ward inclusion rules as the Daily Forecast. It covers all main and physical inpatient wards. Hospital in the Home, virtual beds and short stay assessment unit beds are not included.
Q: How often does the forecast update?
A: Several times a day at scheduled times. It does not refresh every hour. Check Data updated as at under the page heading for the time of the latest run.
Q: Can I forecast more than 72 hours ahead?
A: No. The Hourly Forecast covers up to 72 hours. For a longer view, use the Daily Forecast.
Q: Why don’t the demand and discharge tiles change when I change Forecast Hours?
A: These tiles always show today, from midnight, so you can compare today with a typical day.
Q: Why is the forecast different from what actually happened?
A: The forecast is a modelled estimate, so some difference from the actual number is expected. The shaded range shows how much the forecast could reasonably vary. If you see the forecast consistently over or under for a ward or facility, raise a support ticket so HealthCare Logic can investigate.
Q: Why is the Predicted Discharge Date blank for some patients?
A: Predicted values come from the most recent forecast run. Patients who were not in hospital or booked at the time of that run have no predicted values until a later run includes them.
Q: Why does a value show as a decimal?
A: Values below 0.5 are not rounded down to zero, so that low numbers on small wards stay visible.
Q: Why is the predicted discharge date different from the EDD in our patient system?
A: The forecast uses its own predicted discharge date for each patient. The EDD recorded by the ward is one of the inputs to that prediction, so keeping EDDs up to date improves the forecast.