
Location in SystemView: SystemView > Explore > Surgery > Chronological Management > Booked in Turn
In this article
What it is
The Booked in Turn component shows how Category 2 and 3 elective surgery patients are being booked compared to their expected chronological order.
It highlights where patients have been booked ahead of others on the same doctor's list who rank higher by clinical category and treat-by date, and estimates the theatre time involved. You can analyse bookings by specialty and doctor, see each doctor's trend over time, and find the unbooked patients who are next in turn.
Why it matters
See where booking decisions are creating downstream pressure on theatres and waiting lists.
Out-of-turn booking can affect both fairness and capacity. This component makes that impact visible.
- Identify where booking order does not align with clinical priority and waiting time
- Understand how much theatre time is tied to these decisions
- Compare booking patterns across specialties and doctors
- Support more consistent and transparent scheduling practices
How to use it
Filter to focus your view
Use the filter bar to move from a high-level overview to detailed analysis:
- District: Limits the data to a selected district.
- Facility: Limits the data to a selected hospital. Not every health service has this filter.
- Specialty: Filters data to a specific surgical specialty.
- Doctor: Narrows the view to an individual treating doctor.
Start broad, then focus
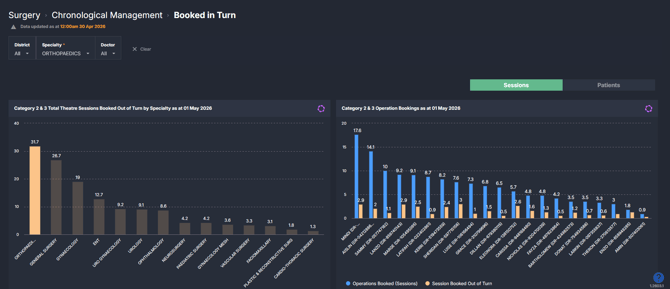
Start with the specialty chart. It shows every specialty with patients booked out of turn, so you can compare them before choosing one. Look for specialties with higher out-of-turn session totals, then filter down.
Identify where impact is highest
Use the Category 2 & 3 Total Theatre Sessions Booked Out of Turn by Specialty chart:
- Specialties are sorted from highest to lowest, so the largest are on the left
- In Sessions view, these represent the largest impact on theatre time, not just patient volume
- Use this to prioritise where to investigate further
Drill down to doctor-level variation
Select a specialty bar, or choose one in the Specialty filter, then review the Category 2 & 3 Operation Bookings chart:
- Compare total sessions booked with sessions booked out of turn
- Look for doctors where out-of-turn sessions make up a larger proportion
- This helps identify variation in booking patterns within the same specialty
Review a doctor's bookings
Select a doctor in the chart or the Doctor filter to open the doctor-level tiles:
- Operation Bookings shows which of the doctor's bookings were made in turn and which were made out of turn
- Unbooked Patients shows who is next in turn, and who could be booked instead
- You can export either table to Excel to review with the doctor or booking team. See How to export in SystemView ›
Check the capacity basis
Use the Summary of the Theatre Sessions Allocated table:
- Review each doctor's allocated sessions, remaining sessions and booked Category 2 and 3 time
- Check the Analysis Used column. It shows whether the figures use the doctor's allocated time (Allocation) or their booked time (Bookings)
- A doctor can show more booked time than allocated time when some of their patients are booked into another doctor's session, or when theatre schedules and the waiting list don't line up
Monitor changes over time
Select a doctor to see their Category 2 & 3 Operation Bookings Trend for the past 12 months:
- Look for increases or decreases in out-of-turn bookings
- Judge change from the trend rather than a single point
Use Sessions vs Patients appropriately
| View | What it represents | How to interpret it | When to use it |
|---|---|---|---|
| Sessions | Estimated procedure time for bookings, including those booked out of turn, grouped into 4-hour (240-minute) theatre sessions. | Longer cases count for more than short ones, so values show the theatre time involved rather than the number of patients. Larger values mean more theatre time. | Use when assessing capacity impact and operational planning, particularly to understand how much theatre time out-of-turn bookings take up. |
| Patients | Count of individual patients in your selection, such as those booked or booked out of turn. | Values show the number of patients, regardless of how much theatre time each needs. Highlights how patients are spread across specialties or doctors. | Use when assessing equity, waiting list order and patient-level impact, for example how many patients are being booked out of turn. |
Explore booking patterns and capacity impact
| Chart / tile name | What it shows |
|---|---|
| Category 2 & 3 Total Theatre Sessions Booked Out of Turn by Specialty | Compares specialties by the theatre sessions booked out of turn (or patients, in Patients view). Select a specialty to open the doctor analysis. |
| Category 2 & 3 Operation Bookings | For the selected specialty, compares each doctor's total booked sessions with the sessions booked out of turn. Select a doctor to open the tiles below. |
| Summary of the Theatre Sessions Allocated | Shows each doctor's allocated sessions, the sessions remaining (excluding Category 1 and NRFS patients) and the Category 2 and 3 time already booked. The Analysis Used column shows whether the out-of-turn calculation used allocated time (Allocation) or booked time (Bookings). |
| Category 2 & 3 Operation Bookings Trend | The selected doctor's out-of-turn bookings over the past 12 months, in sessions or patients. |
| Theatre Sessions Allocated | The selected doctor's upcoming theatre sessions, with the date and length of each. |
| Operation Bookings | The selected doctor's booked Category 2 and 3 patients. Shows whether each was booked in turn or out of turn, their place on the waiting list and the days until breach at their operation date. Colour coding highlights out-of-turn bookings, including those made yesterday. |
| Unbooked Patients | The selected doctor's Category 2 and 3 patients who are not yet booked. Shows who is next in turn and highlights patients who can be booked to keep the list in order. |
Most titles end with “as at” and the current date. The names above are from the Sessions view. In Patients view, the first two charts show patient counts and their titles change to match.
How it works
The Booked in Turn component uses SystemView's chronological management algorithms to compare each doctor's bookings with the order their patients should be booked in.
- Each doctor's Category 2 and 3 patients in a specialty are ranked by clinical category and treat-by date
- The doctor's bookings are checked against this ranking
- A patient is booked out of turn when they are booked ahead of patients who rank higher on the same doctor's list
- The estimated procedure time of the bookings is added up and shown in 4-hour (240-minute) theatre sessions
The calculation is based on the doctor's allocated theatre time. If their Category 2 and 3 bookings exceed the time left in their allocation, it uses their booked time instead. The Analysis Used column in the Summary of the Theatre Sessions Allocated table shows which applies.
The component includes Category 2 and 3 patients only, because Category 1 patients are expected to be booked soon after they join the waiting list. The data updates every morning.
How it helps you
- See where booking practice differs between specialties and doctors
- Understand how much theatre time goes to out-of-turn bookings
- Track whether each doctor's booking practice is improving over time
- See which unbooked patients are next in line to be booked
- Move from specialty-level patterns to doctor and patient-level detail
Best practices
How often should I use it?
| What to do | How often | Who typically does this | Why it helps |
|---|---|---|---|
| Review out-of-turn booking by specialty | Weekly | Surgical services managers, theatre managers | Identifies emerging variation across specialties |
| Drill down to doctor-level patterns | Weekly or as needed | Specialty leads, surgical coordinators | Highlights individual booking variation |
| Review Operation Bookings and Unbooked Patients | Weekly | Booking and scheduling officers, specialty leads | Gives a list of patients to discuss and book next |
| Check the Analysis Used column | Weekly | Theatre schedulers, operational managers | Shows whether a doctor's figures are based on allocated or booked time |
| Review each doctor's trend | Fortnightly or monthly | Specialty leads, surgical services managers | Tracks whether booking practice is improving |
Pair with these components
- 🔗Treated in Turn: Compare booking order with the order patients were treated, including hospital-level trends
- 🔗Booking Auditor: Get a worklist of out-of-turn bookings that could be rebooked, alongside the unbooked patients to prioritise
- 🔗Risks & Projections: Identify patients requiring booking and future demand pressure
- 🔗Waiting List Trends: Understand underlying waiting list size and growth
Tips for success
- Start with specialty-level analysis before drilling into individual doctors
- Compare total sessions with out-of-turn sessions to understand proportional impact
- Use trends rather than single data points to assess change
- Check the Analysis Used column before discussing a doctor's figures
- Be aware that local processes and constraints may influence booking patterns
FAQs
What does “booked out of turn” mean?
A patient is booked out of turn when they are booked ahead of patients on the same doctor's waiting list who rank higher. Patients are ranked by clinical category and treat-by date.
Does this component show patient counts or time impact?
Both. Use the Sessions / Patients toggle at the top right. Sessions shows the estimated theatre time in 4-hour sessions. Patients shows how many patients are affected.
Why might no data appear in some sections?
A specialty only appears in the specialty chart when it has patients booked out of turn, though you can still select it in the Specialty filter. The doctor-level tiles appear once you select a doctor. Some tiles, such as Theatre Sessions Allocated, may show no data depending on your selected filters or local data availability.