
Location in SystemView: SystemView > Explore > Surgery > Waiting List > Trends
In this article:
- What it is
- Why it matters
- How to use it
- How it works
- How it helps you
- Best practices
- FAQs & Troubleshooting
What it is
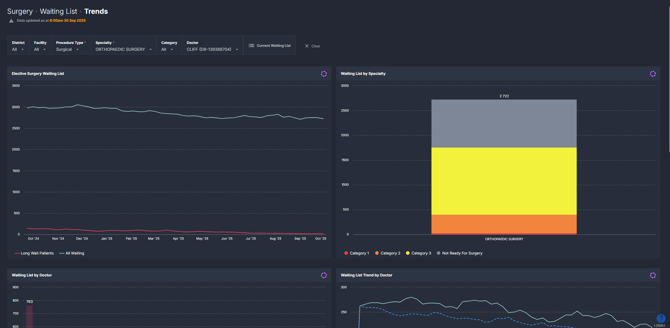
The Waiting List Trends component provides detailed insights into the size and makeup of elective surgery waiting lists. It displays trends across specialties, doctors, and procedures, and highlights the balance between current waiting lists and the Nominal Waiting List Maximum - the maximum number of patients a doctor can manage without breaching clinical timeframes.
Why it matters
See where waitlist pressure is building before patients breach their treatment times.
-
Spot specialties and doctors approaching or exceeding their safe list size.
-
Monitor long-wait patients to prevent clinical risk.
-
Drill down from specialties to individual procedures and treating doctors.
-
Support redistribution of patients across doctors or services to reduce bottlenecks.
How to use it
Filter to focus your view
Use the filter bar to refine your data:
-
Procedure Type: Surgical / Reportable, Non-Surgical / Non-Reportable, Endoscopy.
-
Surgical = procedures reportable to the Department of Health.
-
Non-Surgical = procedures not reportable to the Department of Health.
-
Endoscopy = reported separately but available for monitoring.
-
-
Specialty / Category: Drill into specific specialties or urgency categories.
-
Doctor: View waiting lists by treating doctor.
Explore key waiting list metrics
| Tile name | What it shows |
| Elective Surgery Waiting List | 12-month trend of total waitlist (booked + unbooked) and long-wait patients. |
| Waiting List by Specialty | Current waitlist by specialty and urgency category. Selecting applies filters across the component. |
| Waiting List by Doctor | Breaks down lists by doctor, showing booked and unbooked patients. |
| Waiting List Trend by Doctor | 12-month trend for a doctor with overlay of their Nominal Waiting List - the safe maximum they can manage. |
| Nominal Waiting List Maximum Statistics | Displays a table analysing historical removal rates and the maximum safe list size (see 💡Tip below). |
| Waiting List by Procedure | Displays booked/unbooked patients by procedure, based on specialty and category selection. |
| Waiting List by Procedure for a Doctor | Shows a doctor’s list broken down by procedure and booking status. |
| Current Waiting List (Button) | Opens a patient-level list for the selected filters, including treat-by dates and operation details. |
💡 Tip: The Nominal Waiting List Maximum Statistics table only appears when you click the Nominal Wait Max trendline in the Waiting List Trend by Doctor chart.
How it works
The component uses historical patient activity (treatments and removals) to measure current waiting list volumes. When drilling down in the component, it also compares this against what doctors can safely manage. The Nominal Waiting List Maximum serves as an early warning: if a doctor’s list grows beyond this threshold, some patients are at risk of breaching their clinically recommended treatment times.
Calculation logic
-
Nominal Waiting List Maximum = based on a doctor’s historical removals (treatments + other removals), showing the maximum number of patients they can manage without breaching timeframes.
-
Waiting List totals = all patients currently awaiting surgery, both booked and unbooked.
-
Booked vs Unbooked patients = booked patients have a scheduled procedure date; unbooked do not.
How it helps you
- Compare against safe thresholds: Quickly see whether waiting lists are within the Nominal Waiting List Maximum or at risk of breaches.
- Prioritise long-wait patients: Identify patients approaching or exceeding clinical timeframes for timely scheduling.
- Spot pressure points early: Detect specialties or doctors where waitlists are building beyond safe levels.
- Balance workloads: Redistribute patients across doctors or services to avoid bottlenecks.
- Plan with confidence: Use 12 months of historical trends to forecast demand and guide service planning.
Best practices
How often should I use it
| What to do | How often | Who should do it | Why it helps |
| Review elective surgery waiting list size and trends | Weekly | Booking Officers, Service Managers | Keeps patient flow balanced and within timeframes |
| Monitor Nominal Waiting List Maximum | Weekly | Service Managers, Executives | Identifies doctors at risk of breaching safe list size |
| Drill down to patient-level detail | As needed | Booking Officers, Clinic Admin | Helps action urgent bookings and redistribute patients |
Pair with these components
- 🔗 Waiting List > Risks & Projections: Use alongside Trends to forecast future patient demand (up to 52 weeks ahead) while monitoring current waiting list pressures.
- 🔗 Activity Trends: Combine with waiting list trends to understand whether rising lists are due to lower surgical throughput or increased patient additions.
- 🔗 Waiting List > Patient List: Use with Trends to move from high-level patterns down to patient-level detail, helping you schedule or redistribute cases directly.
Tips for success
- Hover over charts to see exact patient counts and breakdowns.
- Use the Nominal Waiting List Maximum to guide redistribution before breaches occur.
- Always apply specialty and category filters first to generate meaningful downstream charts.
❓FAQs & Troubleshooting
Q. What is the Nominal Waiting List Maximum?
A. It is the maximum number of patients a doctor can manage without breaching clinical timeframes, based on historical removal rates. It acts as a lead indicator for potential long waits.
Q. How do I see trends for my specialty?
A. Apply the Specialty filter or click on a specialty in the chart. All downstream charts update automatically.
Q. How many patients are currently on my waiting list?
A. Use the Waiting List by Category chart for totals, including booked and unbooked patients. Hover over the bars to see category breakdowns.