
Location in SystemView: SystemView > Explore > Outpatients > Outpatient Forecasting Tool
In this article:
- What it is
- Why it matters
- How to use it
- How it works
- Component logic
- How it helps you
- Best practices
- Interactive guide
What it is
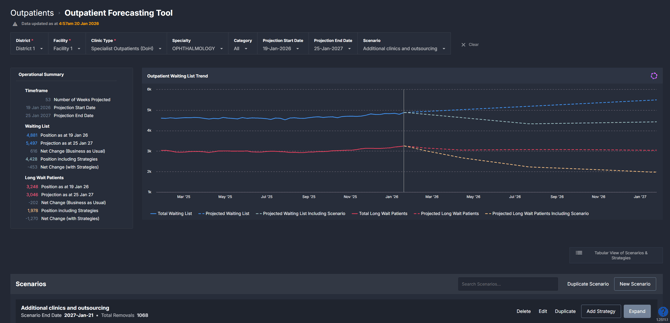
The Outpatient Forecasting Tool provides a forward-looking view of outpatient waiting lists, showing how total waits and long waits are expected to change over time. It combines historical demand and removals with user-defined scenarios to display projected outcomes with and without planned strategies.
This component is designed to support waitlist planning by allowing users to quantify potential actions and compare different approaches before they are implemented.
Why it matters
Move from retrospective reporting to evidence-based waitlist planning.
Outpatient waiting lists are influenced by demand, capacity, and policy decisions that play out over months rather than days. The Outpatient Forecasting Tool helps teams understand not just where the waitlist has been, but where it is likely to go under different assumptions.
It helps teams:
-
Test proposed strategies, such as increased capacity or targeted clinics, before committing resources
-
Quantify the expected impact of actions on long waits and total waitlist size
-
Compare baseline projections against scenario-adjusted outcomes
-
Support planning, investment, and performance discussions with a shared evidence base
-
Explore the potential impact of reduced capacity or increased demand, such as clinic closures, service changes, or anticipated growth in referrals.
How to use it
Filter to focus your view
Use the filters to define the scope of the forecast and the scenarios displayed:
-
District / Health region: Select the district or health region to enable scenario modelling.
-
Facility / Hospital: Select a facility to load and apply scenarios.
-
Clinic Type: Focus on specific outpatient clinic types.
-
Specialty: Narrow the forecast to a particular outpatient specialty.
-
Category: View projections by urgency category.
-
Projection start date: Set the start date for the forecast period.
-
Projection end date: Set the end date for the forecast period.
-
Scenario: Apply a saved scenario to view its impact alongside the baseline forecast.
ℹ️ Note: A district or health region and a facility must be selected for scenarios to be available.
Explore forecast outcomes and scenarios
| Tile name | What it shows |
| Operational Summary | A snapshot of the projected waiting list and long waits at the start and end of the selected projection period, including baseline and scenario-adjusted positions. |
| Outpatient Waiting List Trend | Historical and projected trends for total waiting list and long waits, showing baseline forecasts alongside scenario-applied forecasts for comparison. |
| Scenarios | The scenario workspace where users create, manage, and apply strategies to model their impact on the waiting list over time. |
| Additions and Removals by Week | Weekly additions to and removals from the waiting list, summarised by category and aligned with the selected filters. |
| Long Wait Forecast by Category | Projected long waits over time, broken down by category, with baseline and scenario views. |
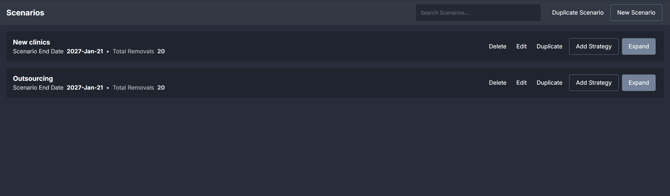
Working with scenarios
The Scenarios section is where users define and manage planned strategies that adjust the baseline forecast.
For step-by-step guidance on creating scenarios, adding strategies, and interpreting scenario results, see How to create and use scenarios in the Outpatient Forecasting Tool ›
Viewing scenario details
![]() Click Tabular view of scenarios & strategies to open a detailed table showing each scenario and its strategies broken down by facility, specialty, category, dates, and expected weekly removals. This view is useful for reviewing assumptions and comparing how strategies are configured across scenarios.
Click Tabular view of scenarios & strategies to open a detailed table showing each scenario and its strategies broken down by facility, specialty, category, dates, and expected weekly removals. This view is useful for reviewing assumptions and comparing how strategies are configured across scenarios.
How it works
The Outpatient Forecasting Tool uses recent outpatient waiting list history to project how the waiting list is likely to change over time.

It first creates a baseline forecast based on recent patterns of referrals being added to the waiting list and patients being removed through appointments or other outcomes. This baseline represents what is expected to happen if current conditions continue.
Users can then apply scenarios that introduce planned changes, such as additional capacity or reduced activity. These scenarios adjust the baseline forecast to show how the waiting list and long waits may change if those strategies are implemented.
Both the baseline and scenario-adjusted forecasts are displayed together so users can compare outcomes over the selected projection period.
Component logic
The Outpatient Forecasting Tool uses historical outpatient waiting list data and defined modelling rules to project future waiting list positions and long waits, both with and without planned strategies applied.
Historical data window
The forecasting model is driven by the most recent 12 weeks of historical data. This period is used to calculate typical patterns of:
-
Additions to the outpatient waiting list, and
-
Removals from the waiting list.
These calculations are performed at the Facility, Specialty, Clinic Type, and Category level, based on the selected filters.
Using a rolling 12-week window allows the model to reflect recent demand and activity patterns, while smoothing out short-term variation.
Baseline forecast logic
The baseline forecast represents expected future waiting list positions if no new strategies are applied.
It is calculated by:
-
Applying the average weekly additions and removals from the historical period, and
-
Projecting those averages forward across the selected projection timeframe.
This baseline provides a reference point against which scenario-based changes can be compared.
Scenario-adjusted forecast logic
When a scenario is applied, the model:
-
Starts from the same baseline assumptions, and
-
Adjusts the forecast using the user-defined strategies entered in the scenario.
These strategies modify the projected removals or capacity assumptions over time, allowing users to see how planned actions may alter future waiting list positions and long waits.
The scenario-adjusted forecast is displayed alongside the baseline to highlight differences between the two views.
Treatment of specific patient groups
To ensure the forecasts are meaningful and consistent, certain patient groups are handled using defined assumptions:
-
Categories with inconsistent target treatment timeframes (i.e., Category 9 / Surveillance Patients) may be excluded from the forecast where required, as inconsistent timeframes can distort projections.
-
Not Ready for Care patients are projected using their assigned urgency category rather than being modelled separately. Future changes in readiness status are not independently forecast.
These rules help ensure the model reflects typical outpatient demand and activity patterns.
How it helps you
-
Test strategies before implementation: Explore the potential impact of different approaches without operational risk.
-
Quantify expected outcomes: Translate planned actions into projected changes in waits and long waits.
-
Support proactive planning: Use forward projections to inform capacity, resourcing, and service planning discussions.
- Support business cases and resourcing decisions: Use scenario comparisons to demonstrate the expected impact of different service approaches or capacity changes on future waiting list positions and long waits.
- Understand risk and pressure points: Use scenarios to explore how reduced capacity or increased demand may affect future waiting list positions and long waits.
-
Align stakeholders: Provide a shared, transparent view of expected outcomes across teams and leadership.
-
Monitor progress over time: Compare projected outcomes with observed trends as strategies are implemented.
Best practices
How often should I use it
| What to do | How often | Who should do it | Why it helps |
| Review baseline projections | Monthly or during planning cycles | Outpatient service managers, performance teams | Establishes an evidence-based view of expected waitlist growth or reduction. |
| Model proposed strategies | As strategies are being considered |
Outpatient managers, planning and analytics teams | Supports informed decision-making before committing resources. |
| Revisit scenarios | After strategy changes | Outpatient service managers | Ensures projections remain aligned with current plans and assumptions. |
Pair with these components
- 🔗 Waiting List > Trends: Use historical trends to understand current pressures before modelling future scenarios.
- 🔗 Waiting List > Patient List: Validate and investigate patient cohorts driving projected changes.
Tips for success
-
Start with the baseline before applying any scenarios.
-
Test more than one scenario to compare different approaches.
-
Keep assumptions realistic and aligned with known service constraints.
-
Use consistent filters when comparing scenarios.
-
Use forecasts to support planning conversations, not exact predictions.
-
Revisit scenarios regularly as plans or demand change.
Interactive guide
Click through the interactive guide below to see the Outpatient Forecasting Tool in action, including how to navigate the component and apply scenarios.
For step-by-step instructions on creating and managing scenarios, see How to create and use scenarios in the Outpatient Forecasting Tool ›
Want a detailed breakdown?
If you’d like a more detailed look at every filter, chart, and tile in this component, you can download the Outpatient Forecasting Tool Guide below.
📎 Download: Outpatient Forecasting Tool Guide