
Location in SystemView: SystemView > Explore > Surgery > Chronological Management > Treated in Turn
In this article:
What it is
The Treated in Turn component provides visibility into how consistently patients are being scheduled and treated in the correct order, according to their time on the waiting list and clinical priority.
It helps surgical teams monitor equity and timeliness in treating patients, and identify areas where out-of-turn treatment may be occurring.
Why it matters
Promote fairness and transparency in surgical scheduling.
Keeping patients treated in turn supports equitable access and helps hospitals meet elective surgery targets. This component enables users to:
- Monitor the proportion of patients treated in chronological order.
- Identify where treatment order varies between specialties or clinicians.
- Support compliance with elective surgery policy frameworks.
- Analyse booking and treatment patterns to improve scheduling fairness.
How to use it
Filter to focus your view
You can explore data by applying filters in the filter bar or dynamically by clicking through charts as you scroll.
This makes it easy to move from hospital-level elective activity down to specialty, doctor, and procedure-level detail. Each level provides progressively more detailed insight into how consistently patients are being treated in turn.
Filters include:
- Specialty: view treated-in-turn performance by specialty.
- Doctor: focus on an individual clinician’s treated-in-turn data.
- Procedure: drill into results for a specific procedure.
- Aggregation type: analyse treated-in-turn trends for different cohorts and groupings:
- By Category: shows data for each category separately.
- By Category Group: combines Category 2 and 3 patients into one view.
Use in combination with the Category filter to define the patient cohort.
- Category: select the elective surgery urgency category to analyse.
- Aggregation period: switch between weekly or monthly views of treated-in-turn data.
- Time period: view results for up to 18 months in the past.
Explore treated-in-turn trends
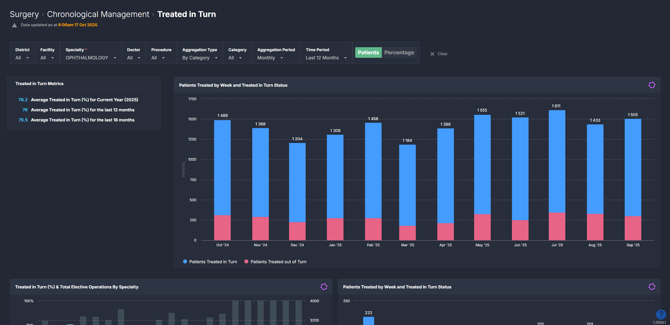
The charts in this component display the total number of elective operations performed within the selected time period, along with the proportion of patients treated out of turn.
You can view these trends at the hospital, specialty, doctor, and procedure level as you drill down.
Use the Patients / Percentage toggle at the top of the component to change how the charts are displayed:
- Patients view: shows the number of patients treated in turn.
- Percentage view: shows the treated-in-turn trend as a percentage.
This allows you to analyse both absolute volumes and proportional performance, providing a clear picture of how consistently patients are being treated in order across each level of detail.

💡 Tip: You can refine your filters as you scroll through the charts — each interaction updates the view below for deeper analysis.
Explore patient-level insights
When you’re filtered to the doctor level, select the Patient List button to open a detailed table of all operations — including those that have already occurred (highlighted in grey) and those that have been booked.
This list lets you see whether each patient has been treated or booked in turn and includes useful details such as:
- Date added to the waiting list
- Operation booking date
- Clinical priority
- Treat-in-turn status (Yes or No)
You can export the patient list to Excel for deeper analysis or reporting — see How to export in SystemView › for step-by-step instructions.
How it works
The component aggregates treated-in-turn data for all completed and scheduled surgeries. As you drill down, the charts dynamically recalculate based on the selected specialty, doctor, or procedure.
Calculation logic
To determine if a patient was treated in turn, SystemView uses the specialty, doctor, category, and a patient’s treat-by date to create a ranking order.
It then analyses whether patients received their surgeries in that order or not, displaying the overall proportion who were treated in turn within the selected filters and time period.
How it helps you
- Monitor scheduling fairness: identify specialties or doctors with higher out-of-turn rates.
- Support planning and governance: demonstrate adherence to chronological management principles.
- Drive equity improvements: highlight cases for audit or review.
- Inform discussions with clinicians: provide data-driven insight into waitlist management behaviour.
- Enable deeper analysis: export patient-level data for validation or operational review.
Best practices
How often should I use it
| What to do | How often | Who should do it | Why it helps |
| Review treated-in-turn trends by specialty | Weekly | Surgical Service Managers | Detect early deviations from fair scheduling |
| Drill to doctor level for audit | Monthly | Theatre & Specialty Coordinators | Identify recurring out-of-turn patterns |
| Export patient list for analysis and validation | As needed | Data Analysist, Business Support | Ensure booking data accuracy and trace reasons for variation |
Pair with these components
- Chronological Management > Booked in Turn
Compare how patients are booked versus treated in order to assess fairness across both stages of the surgical process. - 🔗 Chronological Management > Booking Auditor
Identify out-of-sequence bookings that may lead to patients being treated out of turn. - 🔗 Waiting List > Risks & Projections
Assess whether out-of-turn treatment is affecting patients at risk of breaching their recommended timeframes. - 🔗 Theatre Effectiveness > Utilisation
Explore if treated-in-turn variation aligns with changes in theatre capacity or utilisation.
Tips for success
- Tip: Use the dynamic drill-down to explore performance without manually changing filters.
- Use the Patients / Percentage toggle to contextualise volume versus rate.
- Export the patient list regularly for internal validation and reporting.
- Look for patterns of out-of-turn treatment to guide discussion with clinical teams.
Want a detailed breakdown?
If you’d like a more detailed look at every filter, chart, and tile in this component, you can download the Treated in Turn Guide below.
📎 Download: Chronological Management > Treated in Turn Guide