
Location in SystemView: SystemView > Explore > Surgery > Theatre Effectiveness > Utilisation
In this article:
What it is
The Utilisation component analyses how effectively your theatres are being used within allocated sessions.
It shows when operating rooms were active compared to planned time, and highlights any unused theatre minutes to help identify variation between specialties and doctors.
Why it matters
Track how every theatre minute counts.
- Monitor performance across hospitals, specialties, and doctors to identify underutilised time.
- Reveal patterns of late starts, early finishes, and gaps between sessions.
- Pinpoint the impact of unused minutes on surgical throughput.
- Support operational improvements and performance benchmarking.
How to use it
Filter to focus your view
Use the filter bar to set broad parameters, then click through charts to drill down to finer levels.
Filters include:
- Facility / Hospital: Choose the hospital you want to analyse.
- Session Type: Filter by elective or emergency sessions.
- Time Period: View weekly utilisation trends for up to the past 12 months.
- Theatre Group: Filter between main operating theatres and other procedural areas.
- Calculation: Choose whether to base utilisation on operation start only, include anaesthetic time, or include anaesthetic + changeover time depending on your site setup.
After applying your filters, you can explore deeper by clicking through the charts to move from hospital-level data down to individual specialties, doctors, and sessions.
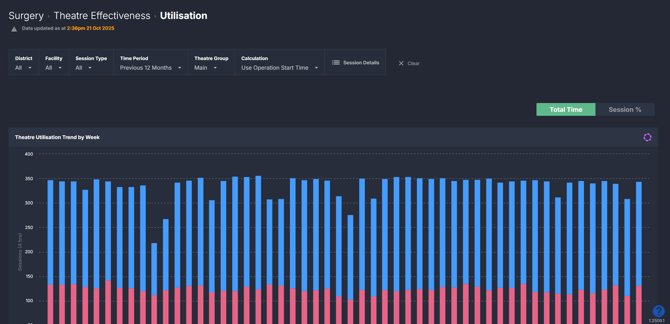
Explore theatre utilisation trends
This component shows total and percentage utilisation, allowing you to compare used and unused theatre time across all levels of analysis.
You can:
- Start at the facility view to see overall utilisation.
- Click into a specialty to see its trend over time.
- Drill into an individual doctor to view their historical utilisation pattern.
- Click on a specific session to see what was planned vs what actually occurred.
Toggle between:
- Total Time: Shows utilisation in four-hour (240 minute) session blocks.
- Session %: Shows the proportion of sessions used, with a trend line of sessions per week for clearer performance tracking.

💡 Tip: You can refine your filters as you scroll through the charts — each interaction updates the view below for deeper analysis.
Explore session detail insights
Click the Session Details button at the top of the component to view a complete list of all theatre sessions that occurred within your selected period.
This table shows:
- Session date and duration
- Consultant/surgeon name and specialty
- Planned start and finish times
- Used vs unused minutes
- Number of elective and emergency operations
- Delays, overruns, and changeover minutes
This list can be exported to Excel for further analysis — ideal for deep-dive reviews or identifying trends by clinician, day, or session type. See How to export from SystemView › for step-by-step instructions.
💡 Tip: If you want to dive deeper into how each metric in the Session Details table is calculated, check out the Theatre Session Details Table › article.
How it works
Utilisation measures the proportion of allocated theatre time that was actively used for operations, compared against the total scheduled time.
Calculation logic
- Patients in Operating Room (OR): The total time patients spent in theatre (‘wheels in’ to ‘wheels out’). This represents the portion of the session when the theatre was actively being used for operations, and will vary depending on the calculation selected in the filters (for example, whether anaesthetic and changeover time are included).
- Other Time: The portion of the session not used for operations. This can include anaesthetic time (if not performed outside the theatre), patient changeovers, late starts, and early finishes.
- Patients in OR %: The proportion of total session time that was used for operations. A higher percentage indicates better utilisation of allocated theatre time.
- Session: A standardised four-hour (240-minute) block of theatre time used as the baseline for utilisation calculations and reporting.
How it helps you
- Identify variation: See which theatres, specialties, or doctors have consistent unused time.
- Validate performance: Cross-check planned vs actual session activity to verify data accuracy.
- Optimise scheduling: Use insights to balance session allocations and reduce idle time.
- Enable deep-dive analysis: Export session data for trend or root-cause investigation.
- Drive improvement: Support data-driven discussions to improve session efficiency.
Best practices
How often should I use it
| What to do | How often | Who should do it | Why it helps |
| Review utilisation trends at hospital and specialty level | Weekly | Theatre Managers, Clinical Leads | Tracks overall efficiency and early signs of variation |
| Drill down into doctor and session data | Monthly | Specialty Leads, Scheduling Team | Supports conversations with clinicians |
| Export session details to Excel for deeper analysis | Monthly | Data Analysts, Managers | Identifies causes of unused minutes or late starts |
| Compare utilisation before and after improvement initiatives | Quarterly | Executives, Performance Teams | Measures impact of interventions |
Pair with these components
- 🔗 Theatre Effectiveness > Late Starts: Identify when theatres started behind schedule and how much this contributed to lost utilisation time.
- Theatre Effectiveness > Early Finishes: See which sessions wrapped up early and how that affected overall efficiency and throughput.
- Theatre Effectiveness > Late Finishes: Understand which lists overran and why, helping to balance future allocations and staff coverage.
- 🔗 Theatre Effectiveness > Day of Surgery (DOS) Cancellations: Correlate cancelled procedures with drops in utilisation to measure their operational impact.
- 🔗 Elective Schedule Monitor: Compare utilisation insights with planned theatre allocations to see where sessions could be restructured or repurposed.
- 🔗 Activity Trends > Elective & Emergency: Track the relationship between theatre utilisation and overall surgical activity to understand whether demand or scheduling drives underuse.
Tips for success
- Use the Session % view for quick comparisons and presentations.
- Start broad and drill down via the charts for specialty or doctor detail.
- Adjust the calculation to reflect your local setup (e.g. include anaesthetic time if performed in the theatre).
- Export session data regularly to validate or trend performance.
- Use Late Starts and Early Finishes components alongside this component for context on unused time.
Want a detailed breakdown?
If you’d like a more detailed look at every filter, chart, and tile in this component, you can download the Theatre Effectiveness Utilisation Guide below.
📎 Download: Theatre Effectiveness > Utilisation Guide
❓ FAQs
Q. Does theatre utilisation include emergency cases?
A. Yes. Utilisation includes both elective and emergency operations by default.
Q. How are the columns in the Session Details table calculated, and what do they mean?
A. For a full breakdown of each metric, see the Theatre Session Details Table › article.