
Location in SystemView: SystemView > Explore > Surgery > Theatre Effectiveness > DOS Cancellations
In this article:
What it is
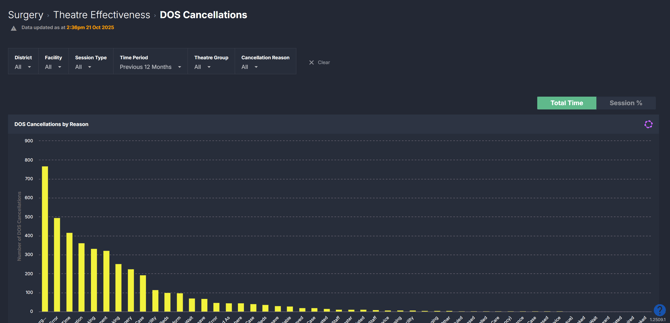
The Day of Surgery (DOS) Cancellations component shows the number and proportion of operations that were cancelled on the day they were scheduled to occur.
It allows you to explore where and why cancellations are happening — across facilities, specialties, and doctors — and compare them to the total number of booked operations.
Why it matters
Every cancelled operation represents lost time, resources, and opportunity for patient care.
- Understand the scale and pattern of day-of-surgery cancellations.
- Identify where cancellations are most frequent and which reasons are most common.
- Reveal patterns linked to particular specialties, theatre groups, or session types.
- Support service improvement and resource planning by targeting recurring causes.
How to use it
Filter to focus your view
Use the filters to refine your analysis..
You can filter by:
- Facility / Hospital: Choose the hospital you want to analyse.
- Session Type: Filter by elective or emergency sessions.
- Time Period: View weekly utilisation trends for up to the past 12 months.
- Theatre Group: Filter between main operating theatres and other procedural areas.
- Cancellation Reason – Focus your view on specific causes such as patient unfit for surgery, no ICU bed, or emergency case required theatre.
After setting your filters, you can explore deeper by clicking through the charts — from hospital to specialty, then to doctor and individual session-level detail.
Explore day of surgery cancellation trends
The charts in this component compare booked operations against day of surgery cancellations, allowing you to see where cancellations are concentrated and how they’ve trended over time.
You can:
- Start at the facility view to see overall cancellation rates.
- Drill into specific specialties to explore which services experience the highest proportion of cancellations.
- Click into a doctor to view their individual allocations and cancellation patterns.
- Select a session to see which operations were cancelled and their reasons.
Toggle between:
-
Total Time: Shows total volumes of booked operations and cancellations.
-
Session %: Displays a trend line showing the percentage of booked operations were cancelled per week.

💡 Tip: Use the Cancellation Reason filter to isolate particular causes and reveal trends that may otherwise be hidden in aggregated data.
How it works
The DOS Cancellations component compares the total number of booked operations with those cancelled on the day of surgery.
Calculation logic
- Booked Operations: All operations that were scheduled for that day.
- DOS Cancellations: The number of those operations that were cancelled on the day of surgery.
- DOS Cancellations %: (DOS Cancellations ÷ Booked Operations) × 100
How it helps you
- Identify trends: Spot increases in day-of-surgery cancellations by specialty, doctor, or reason.
- Reveal systemic issues: Link recurring causes to operational or resource constraints.
- Improve planning: Use historical data to predict and mitigate future cancellations.
- Enhance patient care: Reduce last-minute disruptions and improve theatre efficiency.
Best practices
How often should I use it
| What to do | How often | Who should do it | Why it helps |
| Review cancellation rates by specialty | Weekly | Theatre Managers, Service Leads | Detect early trends or emerging problem areas |
| Analyse reasons for cancellations | Monthly | Clinical Leads & Coordinators | Identify operational bottlenecks or patient factors |
| Drill down to doctor-level cancellations | Monthly | Specialty Leads | Support conversations about workflow or scheduling |
| Correlate cancellations with other components | Quarterly | Executives, Business Analysts | Understand the wider impact on utilisation and throughput |
Pair with these components
- 🔗 Theatre Effectiveness > Utilisation: See how day of surgery cancellations affect overall theatre usage and highlight unused capacity caused by cancelled lists.
- 🔗 Elective Schedule Monitor: Identify scheduling or bed-availability issues that may be contributing to frequent cancellations.
- 🔗 Emergencies Now: Check if emergency cases are displacing elective operations and driving same-day cancellations.
Tips for success
- Focus on Cancellation Reason filtering to uncover actionable insights.
- Isolate DOS Cancellations in the chart legend to focus the analysis.
- Review trends by specialty first, then click through to doctors and sessions for detail.
- Combine with Utilisation › and Late Starts › for a complete picture of theatre efficiency and lost time.
Want a detailed breakdown?
If you’d like a more detailed look at every filter, chart, and tile in this component, you can download the Theatre Effectiveness Day of Surgery Cancellations Guide below.
📎 Download: Theatre Effectiveness > Day of Surgery (DOS) Cancellations Guide
❓ FAQs
Q. How are Day of Surgery cancellations calculated?
A. They represent operations that were booked but cancelled on the same day they were scheduled to take place.