
Location in SystemView: SystemView > Explore > Surgery > Waiting List > Dynamics
In this article:
- What it is
- Why it matters
- How to use it
- How it works
- How it helps you
- Best practices
- FAQs / Troubleshooting
What it is
The Surgery Waiting List Dynamics component tracks weekly additions and removals from the Elective Surgery Waiting List.
It provides a historical view of waiting list activity, helping you see whether new patient additions are being balanced by removals and to understand periods of growth or reduction in the waiting list.
Why it matters
Monitor how demand and activity are shaping your surgical waiting list.
- Identify trends in waiting list growth: See whether additions consistently exceed removals.
- Monitor operational balance: Understand whether current surgical throughput keeps pace with demand.
- Pinpoint fluctuations: Recognise spikes in new additions or dips in removals that could indicate data or scheduling changes.
- Support long-term planning: Use trends to inform service planning and theatre list management.
How to use it
Filter to focus your view
Use the filter bar to refine your data:
-
Procedure Type: Surgical, Non-Surgical, Endoscopy.
-
Surgical = procedures reportable to the Department of Health.
-
Non-Surgical = procedures not reportable to the Department of Health.
-
Endoscopy = reported separately but available for monitoring.
-
-
Specialty: Drill down into a specific surgical specialty.
-
Category: View or exclude data for Category 1, 2, 3 or Not Ready for Surgery patients.
- Doctor: Filter additions and removals attributed to a specific surgeon.
-
Procedure Code: Refine the view to a specific operation code.
💡 Tip: The Doctor filter only becomes available once a specialty has been selected.
Explore weekly waiting list activity
| Chart name | What it shows |
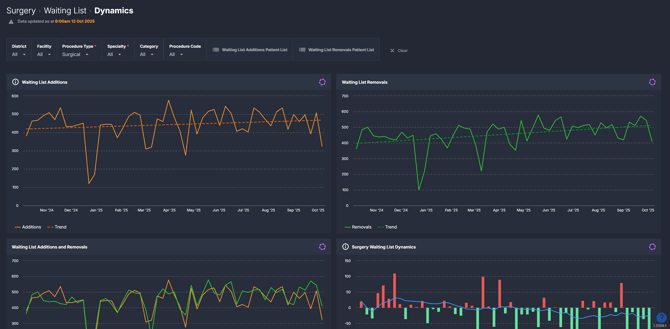
| Waiting List Additions | Weekly number of patients added to the elective surgery waiting list. Hover over a data point to see the total added for that week, or click it to open a patient table showing detailed patient information. |
| Waiting List Removals | Weekly number of patients removed from the waiting list, including those treated, cancelled, or otherwise discharged from the list. |
| Waiting List Additions and Removals | Combined view displaying both weekly additions and removals on the same chart to easily compare inflow versus outflow trends. |
| Surgery Waiting List Dynamics | Displays the difference between weekly additions and removals to highlight the overall impact on the waiting list. Green bars indicate weeks where removals exceeded additions (a reduction in the list), and red bars indicate weeks where additions exceeded removals (list growth). The 13-week rolling average line provides a clear view of overall direction and balance over time. |
ℹ️ Note: Waiting List Dynamics updates weekly and reflects all additions and removals recorded in your hospital source system during that period.
Explore patient-level insights
At the top of the component, you can access two quick-view patient lists:
- Waiting List Additions Patient List: Shows all patients added to the waiting list over the last 12 months.
- Waiting List Removals Patient List: Shows all patients removed from the waiting list over the last 12 months.
These lists can be exported to Excel for further analysis — see How to export in SystemView › for step-by-step instructions.
You can also click any week in the Waiting List Additions or Waiting List Removals charts to open a detailed patient list for that specific week, showing who was added or removed during that period.How it works
The Dynamics component aggregates weekly totals of unique operation records added to or removed from the Elective Surgery Waiting List.
Calculation logic
- Additions = number of patients captured on the waiting list for the first time that week.
- Removals = number of patients removed from the waiting list that week (treated, cancelled, etc.).
- Category logic: When filtered by Category 1, 2 or 3, counts include patients who became that category during the week.
How it helps you
- Track demand: Visualise weekly inflow and outflow to your waiting list.
- Balance resources: Compare patient additions with surgical removals to identify capacity gaps.
- Demonstrate impact: Use the charts to highlight the results of focused work or data clean-up activities — for example, showing the effect of large audits or waitlist reduction efforts.
- Plan smarter: Use weekly patterns to anticipate changes in waiting list size and inform scheduling priorities.
- Communicate clearly: Share quantifiable demand trends with leadership or clinical teams.
Best practices
How often should I use it
| What to do | How often | Who should do it | Why it helps |
| Review weekly additions and removals | Weekly | Specialty Leads, Surgical Coordinators | Detect early signs of waiting list growth or imbalance |
| Compare categories 1–3 trends | Monthly | Clinical Leads, Governance Teams | Identify bottlenecks in urgent vs non-urgent cases |
| Export charts for analysis | As needed | Performance Analysts | Support deeper modelling and trend analysis |
Pair with these components
- 🔗 Waiting List > Risks & Projections: Forecast demand alongside waiting list dynamics to understand future pressure.
- 🔗 Waiting List > Operating Times: Use average operating durations to plan capacity for expected additions.
- 🔗 Waiting List > Trends: Review 12-month trends in waiting list size and long-wait proportions to see how weekly additions and removals have influenced overall performance.
Tips for success
- Hover over any point in the chart for totals; click it to view patient-level details.
- Use Category filters to separate urgent from non-urgent activity.
- Exclude Not Ready for Surgery (NRFS) patients by adjusting the Category filter.
- Export data to Excel for more granular analysis across specialties or doctors.
- Review trends after public holidays or data migrations to check for artificial spikes.
❓FAQs / Troubleshooting
Q. What does Additions mean?
A. Additions represent unique operation records added to the waiting list during that week — not re-listed or adjusted records.
Q. What does Removals mean?
A. Removals represent patients who have been taken off the waiting list during that week. This includes patients who have had their surgery, been cancelled, or otherwise discharged from the list according to source system data.
Q. Why don’t Category totals always match “All”?
A. The “All” view represents total new additions that week. Category 1, 2, or 3 views can include patients whose category changed during the week, so totals may differ.
Q. What does the Waiting List Dynamics chart show?
A. It shows the overall balance between additions and removals.
- Red bars: List growth (more added than removed)
- Green bars: List reduction (more removed than added)
- Rolling average line: Indicates long-term direction of change