
Location in SystemView: SystemView > Explore > Surgery > Treated in Time > Activity
In this article:
What it is
The Treated in Time Activity shows how well your hospital is meeting surgical timeframes. It displays both surgery activity and the percentage of patients treated within recommended timeframes. You can filter by hospital, specialty, surgeon, or procedure to explore performance across your surgical services.
Why it matters
Track timeliness and performance across your surgical services.
- View treated in time performance alongside total surgery volumes for better context and perspective.
- Monitor weekly and year-to-date trends to identify improvements or declines in your service performance.
- Filter by specialty, surgeon, or procedure to pinpoint where access may be delayed.
- Identify and act on areas where wait-time performance may be declining.
How to use it
Filter to focus your view
You can explore data by applying filters in the filter bar or dynamically by clicking through charts as you scroll.
This flexibility allows you to interactively drill from hospital-level activity down to specialty, doctor, and procedure-level trends.
Filters include:
- Procedure Type: Filter by Surgical/Reportable, Non-surgical/Not Reportable and Endoscopy procedure types.
- Specialty: Drill down into a specific surgical specialty.
- Category: Focus on a specific surgical triage category.
- Doctor: Focus on a specific surgeon's activity.
- Procedures: Refine the view to specific operation codes.
- Time period: View your activity up to 12 months in the past.
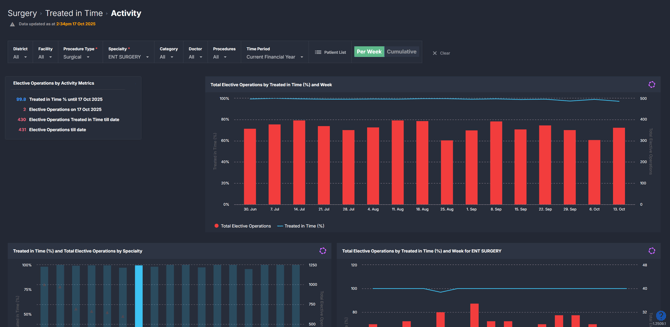
Explore surgical activity and timeliness
As you scroll, you’ll see charts showing the total number of operations performed and the proportion of patients treated within their clinical priority timeframes.
The data automatically updates as you click through filters, helping you explore where timeliness is improving or declining down to the procedure level.
Use the Per Week / Cumulative toggle to change how performance trends are displayed:
- Per Week: Shows weekly volumes and treated-in-time percentages, ideal for spotting short-term fluctuations.
- Cumulative: Displays the progressive totals across your selected date range, helping identify long-term patterns in surgical delivery and timeliness.
Each level—from hospital to procedure—offers a clear visual of surgical throughput compared against treated-in-time performance, giving you instant insight into timely access to surgery.

💡 Tip: You can refine your filters as you scroll through the charts — each interaction updates the view below for deeper analysis.
Explore patient-level insights
Select the Patient List button to open a full list of all operations performed in the chosen timeframe.
Each entry includes key details such as:
- Patient information
- Operation date and procedure
- Surgeon and specialty
- Days waited for surgery
This list can be exported to Excel for auditing, reporting, or deeper analysis. See How to export from SystemView › for step-by-step instructions.
How it works
This component trends elective surgery activity against treated-in-time performance. Data updates dynamically as you filter or drill down, giving real-time insight into where timeliness is improving or slipping.
Calculation logic
-
Treated in Time % = (Number of surgeries performed within clinical priority timeframe ÷ Total surgeries) × 100
How it helps you
- Track timeliness: See how many patients are being treated within timeframe targets.
- Understand context: Compare treated in time rates with overall surgical activity.
- Spot trends quickly: Monitor timeliness patterns by specialty, doctor, or procedure.
- Drill down dynamically: Click through levels of data without re-filtering.
- Export for insight: Review detailed patient-level information for validation or reporting.
Best practices
How often should I use it
| What to do | How often | Who should do it | Why it helps |
| Review treated-in-time trends by specialty | Weekly | Specialty Leads, Theatre Managers | Detect early declines in timeliness |
| Drill down to surgeon or procedure level | Fortnightly | Preoperative Teams | Spot patterns of delay and coordinate with booking or theatre staff to improve turnaround and access times. |
| Export patient list for audit | Monthly | Booking Teams, Data Analysts | Validate timeliness data and support KPI reporting |
Pair with these components
- 🔗 Theatre Effectiveness > Utilisation, Late Starts & Finishes
Use this to identify whether late starts, early finishes, or under-utilised sessions are contributing to lower treated-in-time performance. - 🔗 Waiting List > Risks & Projections
Combine timeliness trends with future risk forecasts to understand how current performance may affect upcoming breaches. - 🔗 Elective Schedule Monitor
Review available theatre sessions and adjust scheduling to prioritise patients at risk of breaching their timeframe. - 🔗 Demand & Capacity > Trends
Assess whether surgical capacity is keeping pace with demand. If timeliness is dropping, this view helps confirm whether additional sessions or resources are required. - 🔗 Chronological Management > Booking Auditor
Check that upcoming bookings align with clinical priority timeframes to maintain treated-in-time performance.
Tips for success
- Click through charts instead of re-filtering to quickly explore activity by specialty, doctor, or procedure.
- Use the Per Week / Cumulative toggle to see short-term fluctuations and long-term performance trends.
- Check Theatre Effectiveness › or Demand & Capacity › trends to understand if utilisation or session gaps are affecting timeliness.
- Cross-check with Waiting List Risks & Projections › to identify patients nearing breach and review current scheduling in the Elective Schedule Monitor ›.
Want a detailed breakdown?
If you’d like a more detailed look at every filter, chart, and tile in this component, you can download the Treated in Time Activity Guide below.
📎 Download: Treated in Time > Activity Guide