
Location in SystemView: SystemView > Explore > Emergency Department > Department Now > Situation Report
In this article:
- What it is
- Why it matters
- How to use it
- How it works
- How it helps you
- Best practices
- FAQs / Troubleshooting
What it is
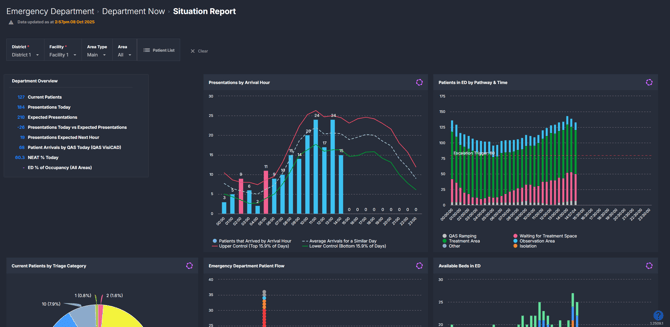
The Situation Report provides a live, data-driven snapshot of your Emergency Department’s current state. It displays how many patients are in the department, their acuity, where they are located, how many are waiting for admission, and how many new arrivals are expected throughout the day.
This component supports ED Nurse in Charge, Medical Leads, and Operations Managers in coordinating safe and efficient care during periods of high demand.
Why it matters
Stay one step ahead of ED demand.
The Situation Report enables ED teams to manage patient flow proactively by showing the department’s real-time position and forecasting incoming presentations.
- Understand current load: See how many patients are in the ED, waiting to be seen, or waiting for admission.
- Anticipate surges: Forecasted arrivals help staff plan for busy periods and resource needs.
- Monitor safety risks: Identify long-wait patients for subspecialty review or admission.
- Coordinate escalation: Support timely, informed escalation to after-hours or executive teams when required.
How to use it
Filter to focus your view
- Area type: Select between All, Main, or Other mapped areas in ED.
- Area: Select specific clinical zones (e.g., Triage, Acute, Minors).
💡Tip: Use Area type = Main to focus on core treatment areas during peak times.
Explore key operational metrics
| Tile name | What it shows |
| Department Overview | A simple snapshot of today: current patients, arrivals so far, expected arrivals next hour, plus NEAT/PET% today and ED occupancy so you can spot pressure early. |
| Presentations by Arrival Hours | How many people arrived each hour today. The chart shows today’s actuals against a typical range (average, higher-than-usual, lower-than-usual) with peaks flagged in red so they stand out clearly. |
| Patients in ED by Pathway & Times | A rolling headcount through the day (every 30 minutes), coloured by where patients are (e.g., treatment or observation areas). With your local escalation trigger line to show when you’re nearing capacity. |
| Current Patients by Triage Category | The acuity mix right now - with the count and proportion of patients by triage category. |
| Emergency Department Patient Flow | A live picture of occupied spaces by area. Colours indicate on-time vs at-risk vs breached patients. Hover to see patient/time details; click to see if they’re waiting for review or an inpatient bed. |
| Available Beds in ED | What treatment spaces are free, by area, across the day (every 30 minutes) - so you can place patients quickly and safely. |
| Patients Waiting | Who is waiting right now and for what: to be seen, subspecialty review, or inpatient admission. Useful for choosing your next unblock. |
| Breaches by Hour of Breach | How many patients passed 4 hours in ED, counted in the hour the breach occurred. Good for reviewing when pressure spiked. |
| Waiting ED Patients by Wait Type & Time | How the queues change over the day (every 30 minutes) for to be seen, subspecialty review, inpatient admission, plus waiting-room cohorts - so you can act before bottlenecks build. |
Explore patient-level insights
Click Patient List at the top of the component to open today’s patient details tables. You’ll see five ready-to-use lists:
- Current patient details: everyone currently in ED.
- Current patients waiting for an inpatient admission: who’s admitted and waiting on a bed.
- Patients waiting for a subspecialty review: consults still outstanding.
- Subspecialty review requests today: all consults requested today.
- Patients discharged today: who left ED today.
Each list shows practical fields like demographics, triage priority, diagnosis, length of stay, and the requested times for admission and subspecialty review, so you can spot long-waiters fast and take action.
💡Tip: The Current patient details list is organised by length of stay, with the longest at the top, handy for prioritising reviews and bed moves.
Explore ambulance analytics (only in environments with ambulance integration)
- Ambulances en route by ETA: Which units are on the way and when they’ll arrive.
- Ambulance ramped patients (by incident/unit/time): Current ramping and minutes ramped; anything over 30 minutes is flagged in red.
- ED arrivals via ambulance by triage & hour: Hourly ambulance arrivals, coloured by triage category, so you can see the incoming acuity mix.
How it works
The Situation Report blends live ED data (current patients, waits, space available) with historical arrival patterns to give a reliable view of what’s happening now and what’s likely next. It updates throughout the day without you needing to refresh.
Calculation logic
-
Expected presentations: The expected presentations in SystemView are based on 2 years of arrivals, adjusted for hour, day of week, and season.
-
Arrival bands: The Presentations by Arrival Hour chart shows today's presentations against average, higher-than-usual (upper control), and lower-than-usual (lower control) presentations.
-
-
ED % of occupancy: Current patients ÷ ED bed capacity.
💡 Tip: You can update ED bed capacity in Beds > Bed Capacity Monitor. See the Bed Capacity Monitor › article for steps.
-
Waiting cohorts: Counts of patients to be seen, awaiting subspecialty review, and awaiting inpatient admission (the time-series also shows waiting-room cohorts).
-
Breaches by hour of breach: Number of 4-hour length-of-stay breaches, counted in the hour the breach happened.
How it helps you
- Know your position now: One screen shows activity, waits, space, and near-term demand.
- Act before queues grow: See where delays are forming and fix the next unblock first.
- Place patients faster: Match free spaces to where demand is building.
- Escalate with confidence: Use arrivals vs expected and occupancy to justify extra resources or escalation.
Best practices
How often should I use it
| What to do | How often | Who should do it | Why it helps |
| Watch status, occupancy, and waits | Continuously during shift | Nurse in Charge, Medical/Clinical Lead | Keeps risks visible and manageable. |
| Check actual vs expected arrivals | Hourly and at handover |
Medical/Clinical Lead, Ops Manager | Times staffing and escalation to upcoming peaks. |
| Scan free spaces and waiting cohorts | Throughout the shift | NUM, Nurse in Charge | Directs safe placement and next best action. |
| Open Patient list to action items | As needed | Clinicians, Operational Leaders | Clears review/admission delays and supports discharge. |
Pair with these components and features
- 🔗 Department Now > Waiting for Admission: Focuses on admitted ED patients waiting on an inpatient bed. Use it with the Situation Report’s Patients waiting and Available beds in ED to coordinate moves with bed management.
- 🔗 Department Now > LoS Monitor: Tracks 4-hour performance and LoS risk so you can see which areas or cohorts are trending to breach and adjust staffing/streaming.
- 🔗 Flow Monitor > Live Patient Flow: A live view of flow and length-of-stay risk by pod/area. Use it alongside Patients in ED by pathway & time to spot where congestion is forming and intervene early.
- 🔗 Beds > Bed Capacity Monitor: Keep ED capacity up to date so ED occupancy and escalation thresholds in Situation Report reflect reality.
- 🔗 Interact > MyHub: You don’t need to open Situation Report every time. Pin the charts you care about into a MyHub, and mix in tiles from other components. That gives you a live ED dashboard tailored to your pod/shift.
Tips for success
- Build a MyHub for your ED. Pin the charts you care about most and add tiles from other components. One you're set up, you'll have a custom live dashboard with all the metrics important to you in one place.
See How to create a MyHub page › for instructions. - Use Area type + Area to focus on zones you can act on right now (e.g., Resus vs Minors).
- Watch hours that exceed the “higher-than-usual” band in the Presentations by Arrival Hour chart - that’s your early-warning for a surge.
- If your site has ambulance integration, keep an eye on En-route, Ramped, and Ambulance arrivals by triage to pre-empt door pressure.
❓FAQs / Troubleshooting
Q. Can I see both current and ED predicted demand here?
A. Yes. The overview shows today’s position and the upcoming forecast; the hourly arrivals chart shows how today compares to a typical day.
Q. Where do I find patient-level details for ED?
A. Click Patient list for the five tables: Current patients; Waiting for admission; Waiting for subspecialty review; Subspecialty review requests today; Discharged today.
Q. Why is ED occupancy different to what I expect?
A. It uses the ED bed capacity set for your site. You can update the capacity in Beds > Bed capacity monitor.
Q. Why don’t I see the ambulance charts?
A. They only appear where your site has an ambulance integration. If you don’t have the feed, those charts won’t display.