
Location in SystemView: SystemView > Explore > Emergency Department > Trends > Subspecialty Reviews
In this article:
What it is
The Subspecialty Reviews component provides a 12-month retrospective analysis of all subspecialty reviews within the Emergency Department. It highlights the number of requests made, associated processing times, and patient outcomes to support continuous monitoring and improvement of subspecialty responsiveness.
Why it matters
Understand team responsiveness to improve patient flow.
- Identify peaks in subspecialty review requests by day and hour.
- Measure review response times against local KPIs.
- Analyse variation in team performance over time.
- Use historical data to support process redesign and escalation protocols.
How to use it
Filter to focus your view
Apply filters at the top of the component to refine your analysis:
- Subspecialty Review Group: Select between All, Main, or Other mapped subspecialty teams in the ED. Allied Health teams are an example of subspecialty teams that are sometimes mapped as Other.
- Subspecialty Team: Filter the component by one or multiple subspecialty teams to focus your analysis on specific areas.
- Timeframe: Adjust the reporting period to display the Last 12 Months, 6 Months, 3 Months, or 7 Days to focus on a shorter window of activity.
Explore key performance trends
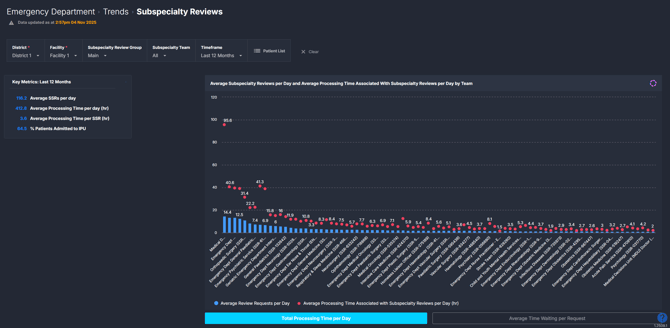
At the top of the component, the Key Metrics summary provides a quick snapshot of average subspecialty reviews per day, average processing time, and average waiting time per request.
Use this summary to understand overall performance at a glance before exploring detailed trends.
You can then use the toggle buttons throughout the component to switch between different chart views of subspecialty review activity, waiting times, and admission trends.
1. Team performance overview
| Chart name | What it shows |
| Average Subspecialty Reviews per Day and Average Processing Time Associated with Subspecialty Reviews per Day by Team | Displays the average number of subspecialty reviews requested and their average processing time for each team. Use this to identify teams with higher request volumes or longer response times. |
| Average Subspecialty Reviews and Average Time Waiting per Subspecialty Review per Day by Team | Shows the average daily reviews and the average waiting time from request to review, highlighting where delays commonly occur. |
Use the chart toggle buttons to switch between total processing time and average waiting time views.
2. Trend analysis over time
| Chart name | What it shows |
| Subspecialty Reviews per Day and Processing Time Associated with Subspecialty Reviews Trend | Tracks daily trends in the number of reviews requested and the total time taken to complete them. Ideal for assessing processing time variability over time. |
| Subspecialty Reviews per Day and Average Time Waiting per Subspecialty Review Trend | Shows daily averages of review requests and the average time waiting per request, helping identify consistent periods of longer waits. |
| Subspecialty Review Requests Admissions Trend | Illustrates the proportion of admitted patients who required a subspecialty review. Use this to explore how reviews relate to admission activity and outcomes. |
Use the buttons to toggle between processing time, waiting time, and admissions views to explore different dimensions of subspecialty review performance trends.
3. Weekly and hour patterns
| Chart name | What it shows |
| Average Requests and Average Time Waiting per Subspecialty Review by Weekday | Highlights the average number of requests and average waiting or processing times for each day of the week. Useful for identifying consistent weekday bottlenecks. |
| Average Requests and Average Processing Time Associated with Subspecialty Reviews by Hour | Displays average requests and processing times by hour of day, helping identify peak demand times and potential resource gaps. |
Use the buttons to toggle between weekday and hourly views to pinpoint when delays most often occur.
Detailed breakdown by patient
Selecting a specific day on any of the trend analysis charts opens the Subspecialty Review Processing Time by Patient table.
This provides a patient-level breakdown of that day’s subspecialty reviews, showing how long each patient spent in each phase of their journey.
Each patient’s timeline is visualised as colour-coded segments, making it easy to see where delays occur in the process and compare against expected response times.
Explore patient details

Use the Patient List button at the top of the component to view and export underlying data:
- Subspecialty Review Requests – A complete list of all subspecialty review requests within your selected filters, including time requested and total time waiting.
- Episode of Care Summary for Patients with Subspecialty Reviews – Key clinical and administrative details for each patient, such as presenting complaint, diagnosis, treating clinician, and outcome.
Both tables can be exported for local analysis or reporting to support service reviews and audits. See How to export from SystemView ›.
How it works
The component compiles 12 months of historical ED subspecialty review data and each chart dynamically reflects your filter selections, allowing team-level or time-based analysis.
Calculation logic
- Average time waiting per request = (Time from request to review start) ÷ Total number of requests
- Average processing time = (Time from review start to completion) ÷ Total number of reviews
How it helps you
- Spot inefficiencies: Identify subspecialty teams with longer processing or waiting times.
- Optimise workforce: Align staffing or escalation strategies with peak review hours.
- Enhance patient flow: Reduce delays between subspecialty review and admission or discharge.
- Support improvement projects: Use data to validate interventions and monitor change.
- Enable evidence-based reporting: Export detailed request and episode data for audits and service reviews.
Best practices
How often should I use it?
| What to Do | How Often | Who Should Do It | Why It Helps |
|---|---|---|---|
| Review team performance trends | Monthly | ED Nurse Unit Managers, Service Improvement Leads | Identify consistent delays or variation by team. |
| Investigate peak request hours | Weekly | ED Admin, Operations Managers | Adjust rosters or review escalation pathways. |
| Audit subspecialty wait times | As needed | ED Director, Business Managers | Validate KPI compliance or respond to complaints. |
Pair with these components
- 🔗 Department Now > Subspecialty Reviews: Compare real-time subspecialty activity with historical trends.
- 🔗 Trends > Demand & Activity: Analyse subspecialty workload against arrival trends.
- 🔗 Flow Monitor > Historical Patient Flow: Review department congestion patterns alongside review delays.
Tips for success
- Click the chart buttons to toggle between key trend views.
- Select any day to explore detailed patient-level timelines.
- Use the Patient List button to access raw data for local reporting.
- Export › tables and charts for inclusion in quality audits or improvement projects.
Want a detailed breakdown?
If you’d like a more detailed look at every filter, chart, and tile in this component, you can download the Emergency Department Subspecialty Reviews Trends Guide below.
📎 Download: Emergency Department > Trends > Subspecialty Reviews Guide
❓FAQs
Q. Why don’t I see data for some teams?
A. Some subspecialty teams may not record requests in a structured format. Ensure your filters match data availability.
Q. Can I export patient details?
A. Yes. Both the Subspecialty Review Requests and Episode of Care Summary tables can be exported as Excel files.