
Location in SystemView: SystemView > Explore > Outpatients > Clinic Effectiveness > Cancellations
In this article:
- What it is
- Why it matters
- How to use it
- How it works
- How it helps you
- Best practices
- FAQs / Troubleshooting
What it is
The Cancellations component highlights where and when outpatient appointments are being cancelled. It breaks cancellations down by doctor, clinic, reason, and timing - helping teams identify trends and understand whether patients or the hospital initiated the cancellation.
Why it matters
Understand cancellation patterns and how they’re impacting clinic activity.
- Identify patterns in cancellations across clinics, doctors, or specialties.
- Use insights to improve booking efficiency, reduce last-minute cancellations, and recover appointment capacity.
- Monitor how far in advance appointments are cancelled and who cancels them.
- View detailed patient-level information to support follow-up or service improvement.
How to use it
Filter to focus your view
Use filters to narrow your analysis to specific services or clinic contexts:
- Specialty: Focus on a specific clinical specialty.
- Doctor: View cancellation trends by individual doctor or resources.
- Clinic Code: Focus on a specific clinic or location.
- Appointment Type: Filter by new or review appointments.
- Appointment Mode: Distinguish between in-person, telehealth, or other modes.
- Days of Week: View data for selected clinic days.
- Appointment Time Slots: Narrow to specific times of day or session slots.
- Cancellation Type: Choose to view all cancellations or filter by Patient or Hospital origin.
- Cancellation Date: Filter by when the appointment was cancelled.
Explore cancellation trends and clinic activity
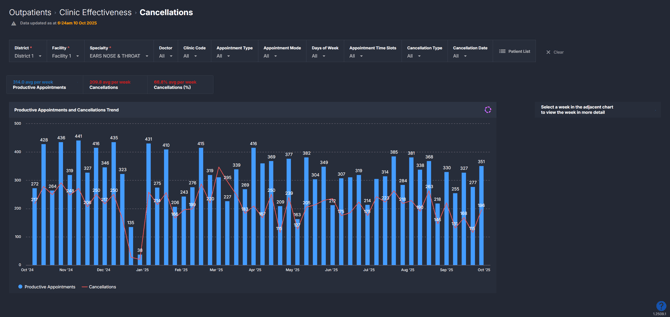
The first page in this component provides a high-level overview of cancellations across your selected filters.
| Tile name | What is shows |
| Summary Tiles | Snapshot of average productive appointments per week, average cancellations, and the average percentage of cancellations per week. |
| Productive Appointments and Cancellations Trend | 12-month trend of total productive vs cancelled appointments. |
💡Tip: Add these to a MyHub › alongside other Clinic Effectiveness components tiles and charts to monitor overall outpatient performance and lost capacity.
Dive deeper into a selected week
Click into a week on the Productive Appointments and Cancellations Trend chart to explore more trends in greater detail.
| Chart name | What it shows |
| Cancellation Type Originator | Bar chart showing the number of cancelled appointments by origin (Patient, Hospital, or Unknown) for the selected week. |
| Productive Appointments and Cancellations by Doctor | Breakdown of total productive appointments and cancellations by each doctor for the selected week. |
| Productive Appointment Schedule | Visual schedule of appointment distribution, showing when cancellations occur by day and time slot. |
| Productive Appointments and Cancellations by Clinic | Comparison of productive appointments and cancellations activity by clinic. *Only appears when you select a day and time slot on the Productive Appointment Schedule. |
| Productive Appointments and Cancellations Trend | Weekly trendline for productive appointments and cancellations for the selected day and time slot (e.g., if you click Tuesday AM, it will show the last 12 months of Tuesday morning appointments and FTAs/DNAs). |
To return to the main overview, click Clear filters and return at the top of the component.
💡 Tip: Appointments by Clinic and Cancellations Trend charts only display after selecting a specific day and time slot on the Cancellations Appointment Schedule.
Explore patient-level insights
Click on the Patient List at the top of the component to explore appointment-level detail for the past 12 months or the selected week.
This list displays all productive (attended) appointments as well as appointments that were cancelled. Cancellations are clearly flagged in red within the Appointment Result column so you can easily spot appointments which were cancelled.
At the end of the table, you’ll also see summary columns showing:
- Number of reviews the patient has had in this specialty over the past 2 years.
- Number of cancellations the patient has had over the past 2 years.
- Cancellation reason to show the exact reason recorded in the source system.
- Cancellation date showing exact date the cancellation occurred.
- Cancellation days notice to highlight many days before the appointment it was cancelled.
- Cancellation originator indicating whether the patient or hospital cancelled the appointment.
This view gives a complete picture of cancellation behaviour and supports analysis, such as comparing cancellation volumes against booking trends or identifying common reasons for short-notice cancellations. You can export the list to Excel for reporting or local review. See How do I export charts and tables ›.
ℹ️ Note: Your SystemView environment may not display cancellation reasons if this information hasn’t been mapped from your hospital’s source system.
How it works
The component analyses scheduled outpatient appointments recorded as Cancelled in the hospital’s source system. It captures who cancelled, when the cancellation occurred, and the reason entered.
Calculation logic
- Cancellation rate = (Number of cancelled appointments ÷ Total booked appointments) × 100
-
Productive appointments = Appointments attended and completed (excluding DNAs and cancellations)
How it helps you
- Monitor trends: Identify when and why cancellations occur most often.
- Reduce lost capacity: Spot patterns that can inform rescheduling or reminder strategies.
- Improve planning: Understand which clinics or appointment types are most affected by cancellations.
- Support follow-up: Use patient-level data to target improvement initiatives.
- Validate data accuracy: Ensure cancellation reasons are recorded consistently.
Best practices
How often should I use it
| What to do | How often | Who should do it | Why it helps |
| Review cancellation rates and trends | Weekly | Clinic Managers, Admin Teams | Identify high cancellation periods and possible causes. |
| Drill down by doctor or clinic | As needed | Service Leads, Outpatient Managers | Identify teams or time slots with higher cancellation rates. |
| Drill into cancellation reasons | As needed | Service Leads, Outpatient Managers | Understand whether patients or the hospital are driving most cancellations. |
| Export patient-level data | Monthly | Admin Teams | Support service improvement, planning, and auditing. |
Pair with these components
- 🔗 Clinic Effectiveness > FTA / DNA Trends: Understand how FTAs and cancellations together impact lost clinic time.
- 🔗 Clinic Effectiveness > Discharges: See whether higher discharge activity corresponds with fewer cancellations.
- 🔗 Clinic Effectiveness > New & Review Appointments: Compare cancellations against productive appointment types to find which are most affected.
- 🔗 Interact > MyHub: Combine cancellation tiles with other Clinic Effectiveness metrics to build a comprehensive view of outpatient performance. See How to create a MyHub › for instructions.
Tips for success
- Filter by cancellation type: Easily distinguish between patient-initiated and hospital-initiated cancellations.
- Use cancellation date filters: Identify when most cancellations are happening to guide intervention timing.
- Review reasons regularly: Spot systemic or recurring causes for cancellations.
- Combine with Cancellations data: Get a full picture of appointment gaps and lost time.
- Check data accuracy: Ensure reasons and origins are recorded properly in the hospital’s source system.
Want a detailed breakdown?
If you’d like a more detailed look at every filter, chart, and tile in this component, you can download the Clinic Effectiveness Cancellations Guide below.
📎 Download: Clinic Effectiveness > Cancellations Guide
❓FAQs / Troubleshooting
Q. Why aren’t any cancellations appearing?
A. Check your filters and confirm that cancellations are being recorded in your hospital’s source system. If you believe cancellations are occurring but none appear, it may be a data entry issue — SystemView relies on appointments being correctly inputted as ‘Cancelled’ in your hospital source system.
Q. How do I return to the overview after I've clicked into a week?
A. Click Clear filters and return at the top of the component to go back.
Q. Can I export cancellation data?
A. Yes — click ‘Patient list’ and export the data to Excel for deeper analysis or reporting.