
Location in SystemView: SystemView > Explore > Outpatients > Clinic Effectiveness > FTA / DNA Trends
In this article:
- What it is
- Why it matters
- How to use it
- How it works
- How it helps you
- Best practices
- FAQs / Troubleshooting
What it is
The FTA / DNA Trends component helps you monitor patient non-attendance across clinics, doctors, and appointment types. It highlights when and where non-attendance is occurring and allows you to drill down for deeper insight - right down to individual patient records.
Why it matters
See when and where non-attendance is impacting clinic activity.
- Identify non-attendance patterns across time, specialty, and doctor.
- Understand which clinics or sessions experience the highest no-show rates.
- Support demand management by analysing the impact of non-attendance on productive appointments.
- Use patient-level data to support targeted improvement strategies.
How to use it
Filter to focus your view
Use filters to narrow your analysis to specific services or clinic contexts:
- Specialty: Focus on a specific clinical specialty.
- Doctor: View non-attendance trends by individual doctor or resources.
- Clinic Code: Focus on a specific clinic or location.
- Appointment Type: Filter by new or review appointments.
- Appointment Mode: Distinguish between in-person, telehealth, or other modes.
- Days of Week: View data for selected clinic days.
- Appointment Time Slots: Narrow to specific times of day or session slots.
Explore non-attendance trends and clinic activity
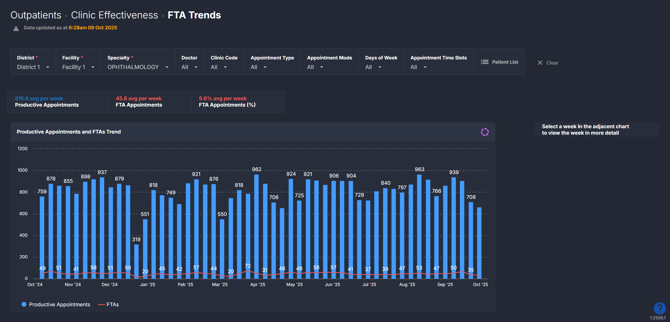
The first page in this component provides a high-level overview of FTAs/DNAs across your selected filters.
| Tile name | What is shows |
| Summary Tiles | Snapshot of average productive appointments per week, average FTAs / DNAs, and the average percentage of FTAs/DNAs per week. |
| Productive Appointments and FTAs/DNAs Trend | Trend of total productive vs FTA / DNA appointments over time to identify patterns in clinic activity. |
💡Tip: Add these to a MyHub › alongside other Clinic Effectiveness components tiles and charts to build a complete view of your outpatient activity.
Dive deeper into a selected week
Click into a week on the Productive Appointments and FTAs/DNAs Trend chart to explore more detailed trends and doctor-level patterns.
| Chart name | What it shows |
| Productive Appointments and FTAs/DNAs by Doctor | Breakdown of total productive appointments and FTAs/DNAs by each doctor for the selected week. |
| Productive Appointment Schedule | Visual schedule of appointment distribution and FTAs/DNAs by day and time (AM or PM) |
| Productive Appointments and FTAs/DNAs by Clinic | Comparison of productive appointments and FTA/DNA counts by clinic. *Only appears when you select a day and time slot on the Productive Appointment Schedule. |
| Productive Appointments and FTAs/DNAs Trend | Weekly trendline for productive appointments and FTAs/DNAs for the selected day and time slot (e.g., if you click Tuesday AM, it will show the last 12 months of Tuesday morning appointments and FTAs/DNAs). |
To return to the main overview, click Clear filters and return at the top of the component.
💡 Tip: Appointments by Clinic and FTAs/DNAs Trend only display after selecting a specific day and time slot on the FTA Appointment Schedule.
Explore patient-level insights
Click on the Patient List at the top of the component to explore appointment-level detail for the past 12 months or the selected week.
This list displays all productive (attended) appointments as well as appointments that were not attended. FTAs/DNAs are clearly flagged in red within the Appointment Result column so you can easily spot non-attenders.
At the end of the table, you’ll also see two summary columns showing:
- Number of reviews the patient has had in this specialty over the past 2 years.
- Number of FTAs/DNAs the patient has had over the past 2 years.
This is particularly useful for identifying patients with a high rate of non-attendance who may be suitable for discharge to free up capacity for other patients. This table is perfect for reporting or analysing patient data — and can be easily exported to Excel for deeper review. See How do I export charts and tables ›.
How it works
The component analyses scheduled outpatient appointments and compares total booked and attended appointments to those recorded as failed-to-attend. When you drill into a week, the charts refresh to display the selected week’s FTA activity across clinics, doctors, and time slots.
Calculation logic
- FTA / DNA rate = (Number of failed-to-attend appointments ÷ Total booked appointments) × 100
-
Productive appointments = Completed appointments excluding DNAs/cancellations.
How it helps you
- Spot attendance issues early: Identify trends in patient non-attendance.
- Improve booking efficiency: Understand when and where FTAs/DNAs most often occur.
- Optimise clinic schedules: Adjust session times based on attendance patterns.
- Enhance patient follow-up: Use patient-level data to target reminders or outreach.
- Monitor service impact: Quantify how FTAs/DNAs affect clinic productivity.
Best practices
How often should I use it
| What to do | How often | Who should do it | Why it helps |
| Review FTA/DNA rates and trends | Weekly | Clinic Managers, Admin Teams | Spot emerging patterns in non-attendance. |
| Drill down by doctor or clinic | As needed | Service Leads, Outpatient Managers | Identify teams or time slots with higher FTA/DNA rates. |
| Export patient list for audits | Monthly | Admin Teams | Support follow-up and outreach initiatives. |
Pair with these components
- 🔗 Clinic Effectiveness > New & Review Appointments: Compare FTA/DNA patterns to productive appointment trends and identify if certain appointment types are driving non-attendance.
- 🔗 Clinic Effectiveness > Cancellations: Understand how cancellations and FTAs/DNAs together affect overall appointment loss and capacity.
- 🔗 Demand & Activity: See how FTAs/DNAs impact your actual activity versus expected demand.
- 🔗 Interact > My Hub: Combine FTA/DNA tiles and charts with other Clinic Effectiveness metrics to create a customised dashboard showing your full outpatient picture. See How to create a MyHub › for instructions.
Tips for success
- Filter by specialty or clinic: Focus on areas where FTAs/DNAs are known to be higher.
- Drill into busy weeks: Identify time slots or doctors with consistently high FTA/DNA counts.
- Export regularly: Use the patient list for monthly review or reporting.
- Combine with Cancellations data: Get a full picture of appointment gaps and lost time.
Want a detailed breakdown?
If you’d like a more detailed look at every filter, chart, and tile in this component, you can download the FTA / DNA Trends Guide below.
📎 Download: Clinic Effectiveness > FTA / DNA Trends
❓FAQs / Troubleshooting
Q. Why are some clinics not showing FTAs/DNAs?
A. Check your filters and confirm that data exists for the selected date range. If you believe FTAs are occurring but none appear, it may be a data entry issue - SystemView relies on appointments being correctly flagged as ‘Failed to Attend’ in your hospital’s source system.
Q. How do I return to the overview after I've clicked into a week?
A. Click ‘Clear filters and return’ at the top of the component to go back.