
Location in SystemView: SystemView > Explore > Outpatients > Clinic Effectiveness > Discharges
In this article:
- What it is
- Why it matters
- How to use it
- How it works
- How it helps you
- Best practices
- FAQs / Troubleshooting
What it is
The Discharges component shows discharge trends across your outpatient clinics. It highlights which doctors and clinics are discharging patients, when those discharges are occurring, and overall discharge proportions - helping you assess clinic flow and patient management efficiency.
Why it matters
See who’s being discharged, when, and how it affects your clinic flow.
- Monitor discharge trends by clinic, doctor, and specialty.
- Understand how discharge timing impacts demand and follow-up appointments.
- Support service planning by identifying clinics with low or high discharge rates.
- Use patient-level insight to ensure discharges are appropriate and well-documented.
How to use it
Filter to focus your view
Use filters to narrow your analysis to specific services or clinic contexts:
- Specialty: Focus on a specific clinical specialty.
- Doctor: View discharges by individual doctor or resources.
- Clinic Code: Narrow your view to a single clinic.
- Appointment Type: Filter by new or review appointments.
- Appointment Mode: Distinguish between in-person, phone, telehealth, or other modes.
- Days of Week: View data for selected clinic days.
- Appointment Time Slots: Narrow to specific times of day or session slots.
Explore discharge trends and clinic activity
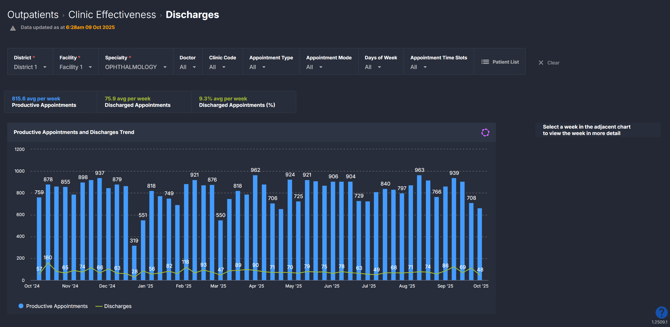
The first page provides a high-level overview of discharges across your selected filters.
| Tile name | What is shows |
| Summary Tiles | Snapshot of average weekly discharges, discharge rate, and productive appointments. |
| Productive Appointments and Discharges Trend | 12-month trend of total appointments with the proportion of those that resulted in being discharged from the service. |
💡Tip: Add these to a MyHub › alongside other Clinic Effectiveness components tiles and charts to build a complete view of your outpatient activity.
Dive deeper into a selected week
Click into a week on the Productive Appointments and Discharges Trend chart to explore discharge patterns in more detail.
| Chart name | What it shows |
| Productive Appointments and Discharges by Doctor | Breakdown of total productive appointments and discharges by each doctor for the selected week. |
| Productive Appointment Schedule | Visual schedule of appointment distribution and when discharges occured by day and time. |
| Productive Appointments and Discharges by Clinic | Comparison of appointment and discharge activity across clinics. *Only appears when you select a day and time slot on the Discharge Appointment Schedule. |
| Productive Appointments by Result | Displays the outcomes of productive appointments over the previous 52 weeks and the percentage of each outcome. |
| Productive Appointments and Discharges Trend | Weekly trendline for productive appointments and discharge rates for the selected day and time slot (e.g., if you click Tuesday AM, it will show the last 12 months of Tuesday morning appointments and discharges). |
To return to the main overview, click Clear filters and return at the top of the component.
💡 Tip: Appointments by Clinic, Discharge Trend, and Appointments by Results charts only display after selecting a specific day and time slot on the Productive Appointment Schedule.
Explore patient-level insights
Click on the Patient List at the top of the component to explore appointment-level detail for the past 12 months or the selected week.
This list mirrors the one in New & Review Appointments ›, showing all productive appointments with an Appointment Result column - in this component, discharges are highlighted in green. A final column also shows how many review appointments the patient has had in that specialty over the past 2 years.
It’s useful for comparing discharge volumes against review appointments or analysing how many reviews patients typically have before discharge. You can export the list to Excel for reporting or analysis. See How do I export charts and tables ›.
How it works
The component analyses outpatient appointment data where a discharge outcome has been recorded. Data refreshes daily and updates as discharges are entered in the hospital’s source system.
Calculation logic
- Discharge rate = (Number of discharged appointments ÷ Total attended appointments) × 100
-
Productive appointments = Completed appointments excluding DNAs/cancellations.
How it helps you
- Track discharge trends: Understand how discharges vary by clinic, doctor, or appointment type.
- Improve flow: Identify clinics where patients are being retained longer than expected.
- Plan capacity: Use discharge data to forecast future appointment availability.
- Ensure accurate data: Monitor discharge recording consistency across clinics.
- Support quality improvement: Use patient-level lists for discharge audits.
Best practices
How often should I use it
| What to do | How often | Who should do it | Why it helps |
| Review discharge rates and trends | Weekly | Clinic Managers, Admin Teams | Track trends and ensure discharges are being recorded accurately. |
| Drill into specific doctor or clinic | As needed | Service Leads, Outpatient Managers | Identify variations in discharge practices. |
| Export patient list for audits | Monthly | Admin Teams | Support local discharge audits and clinic performance reviews. |
Pair with these components
- 🔗 Clinic Effectiveness > New & Review Appointments: See how discharge patterns align with new and review appointment ratios.
- 🔗 Clinic Effectiveness > FTA / DNA Trends: Identify whether high FTA rates influence discharge decisions.
- 🔗 Clinic Effectiveness > Cancellations: Review whether cancellation trends affect discharge rates or timing.
- 🔗 Interact > MyHub: Combine discharge tiles with other Clinic Effectiveness metrics to build a complete dashboard view of clinic efficiency and flow. See How to create a MyHub › for instructions.
Tips for success
- Filter by specialty: Focus on services with high review volumes or long follow-up periods.
- Drill into weeks: Identify which clinics or doctors have unusually low or high discharge rates.
- Check data entry accuracy: Discharge metrics rely on appointments being flagged as ‘Discharged’ in your hospital’s source system.
- Export for audits: Use the patient list for follow-up, review planning, or service improvement reports.
Want a detailed breakdown?
If you’d like a more detailed look at every filter, chart, and tile in this component, you can download the Clinic Effectiveness Discharges Guide below.
📎 Download: Clinic Effectiveness > Discharges Guide
❓FAQs / Troubleshooting
Q. Why aren’t any discharges appearing?
A. Check your filters and confirm that discharges are being recorded in your hospital’s source system. If you believe discharges are occurring but none appear, it may be a data entry issue — SystemView relies on appointments being correctly inputted as ‘Discharged’ at the hospital level.
Q. How do I return to the overview after I click into a week?
A. Click ‘Clear filters and return’ at the top of the component to go back to the main page.
Q. Can I export discharge data?
A. Yes — click the Patient List and export the data to Excel for deeper analysis or auditing.