
Location in SystemView: SystemView > Explore > Outpatients > Wait Times > Current Waiting List
In this article:
- What it is
- Why it matters
- How to use it
- How it works
- How it helps you
- Best practices
- FAQs / Troubleshooting
What it is
The Current Waiting List component provides a comprehensive view of all patients currently waiting for an outpatient appointment. It displays the size of each specialty’s waiting list, their current median waiting times, and how long patients have been waiting, helping you identify teams and clinics experiencing extended delays.
Why it matters
Understand your outpatient wait times and backlog at a glance.
- Monitor performance: Track the volume and waiting times for every specialty or clinic.
- Identify bottlenecks: Spot which teams have the the largest amount of long waits or unbooked referrals.
- Support prioritisation: Use visual wait-time distributions to guide scheduling and service redesign.
- Access detailed insights: Drill down to patient level for targeted action.
How to use it
Filter to focus your view
Use the filter bar to refine the component:
-
Clinic Type: Specialist and Other
-
Specialist = clinics that are reportable to your Department of Health (e.g., consultant- or registrar-led clinics)
-
Other = non-reportable clinics (e.g., allied health or nurse-led)
-
-
Specialty: focus on referrals for a particular outpatient specialty.
- Wait Status: see patients who are booked or unbooked for an appointment.
-
Category: view by urgency triage category.
-
NRFC/Suspended: identify patients marked as Not Ready for Care.
Explore key waiting time metrics
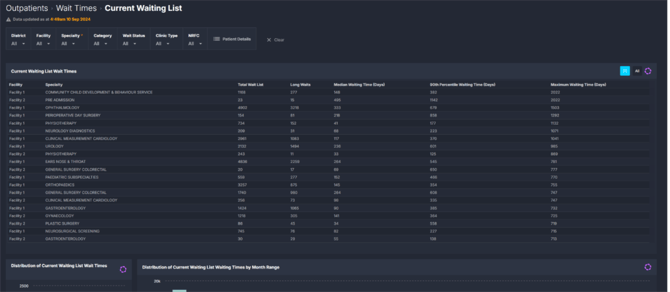
The Current Waiting List component lets you view and monitor every specialty, the size of their total waiting list, and their current median waiting times. You can identify teams with higher waiting times, and understand how long patients have been waiting by analysing the box and whisker charts.

This component includes:
- Each specialty’s total number of waiting patients, the number of long waits (overdue / over target) and median waiting time.
- Box and whisker charts to help visualise the variance of waiting times, from the median to the outliers.
- The distribution of current waiting times across all specialties or selected filters by months.
Depending on your SystemView environment, you may also see:
-
Current Waiting List by Category and Specialty which compares total volumes and wait times across specialties and triage categories.
You can drill down to the specialty level to explore detailed performance trends and identify where wait times are highest.
The box and whisker charts also help you act on data:
- Use the 95th percentile and maximum wait days to understand the spread of outliers and identify long-wait patients that may need follow-up or data validation.
- Use median waiting times to inform internal reporting, set realistic benchmarks, and plan actions to address backlogs.
💡Tip: Learn how to interpret box and whisker charts in our article: How to interpret Box and Whisker Charts in SystemView ›.
Explore patient-level insights
Select Patient Details at the top of the component to view all patients currently waiting for an outpatient appointment within your filtered selection. This list is automatically sorted by patients next in line for an appointment based on their wait days and triage category.
This list is handy to export to Excel › for deeper analysis or save to MyLists › or MyHub › for ongoing reference.
How it works
The component aggregates all active outpatient referrals that have not yet had an appointment. Waiting times are calculated as the number of days between the referral received date and today’s date.
Calculation logic
- Wait days = Today’s date – Referral received date
- Median wait time = 50th percentile of wait days within the selected cohort
How it helps you
- See your backlog clearly: View total waiting volumes and median waits by specialty.
- Focus on the longest waits: Identify specialties or triage categories needing prioritisation.
- Monitor progress: Track how wait times shift over time as clinics improve throughput.
- Access patient-level detail: Export and act on the full waiting list for immediate follow-up.
Best practices
How often should I use it
| What to do | How often | Who should do it | Why it helps |
| Review specialty wait-times | Weekly | Scheduling and Booking Officers, Nurse Unit Managers | Detect early signs of backlog build-up and prioritise timely booking |
| Monitor long-wait specialties | Fortnightly | Care Coordinators, Service Improvement Officers | Support proactive and targeted scheduling |
| Review wait-time variance and outliers | Monthly | Project Officers, Service Improvement Teams | Identify systemic issues and support backlog reduction initiatives |
Pair with these components
- Wait Times > Times Seen: View historical wait times by doctor and clinic to compare with your current waiting list, helping identify where delays occur and inform actions to reduce future waiting times.
- 🔗 Waiting List > Patient List: Easily find your top-waiting (outlier) patients to spot check in your source system, and filter by ‘Undefined’ wait groups to identify possible data errors.
- 🔗 Waiting List > Risks & Projections: Identify which patients are most at risk of breaching their recommended treatment timeframes.
- 🔗 Demand & Activity: Compare referral demand against appointment activity to understand service pressure.
- 🔗 Waiting List > Dynamics: Review how waiting list additions and removals affect overall performance and wait times.
Tips for success
- Drill down to specialty level: Identify specific services with extended waiting times or imbalance between booked and unbooked patients.
- Use outliers for action: Prioritise patients waiting significantly longer than the median to reduce backlog.
- Report median waits regularly: Use the median as a key performance measure for internal reporting and resource planning.
- Check chart variability: Charts showing unusually high maximum wait times may indicate data quality issues in the source system — review and clean up where needed.
- Filter before exporting: Apply filters to focus on a manageable patient cohort before exporting to Excel.
❓FAQs / Troubleshooting
Q. How often is the data updated?
A. The data refreshes automatically every morning, ensuring wait times and patient counts reflect the latest referral information.
Q. What does the median wait time represent?
A. The median is the middle value — also known as the 50th percentile — of all patient waiting times. It’s similar to an average, but unlike a mean, it isn’t skewed by a few patients with extremely long waits, making it a more accurate measure of typical waiting time across specialties.
Q. Can I export the data?
A. Yes. Use the Patient Details button to export all patients currently waiting within your selected filters to Excel for further analysis.