
Location in SystemView: SystemView > Explore > Surgery > Activity Trends > Elective by Category
In this article:
- What it is
- Why it matters
- How to use it
- How it works
- How it helps you
- Best practices
- FAQs / Troubleshooting
What it is
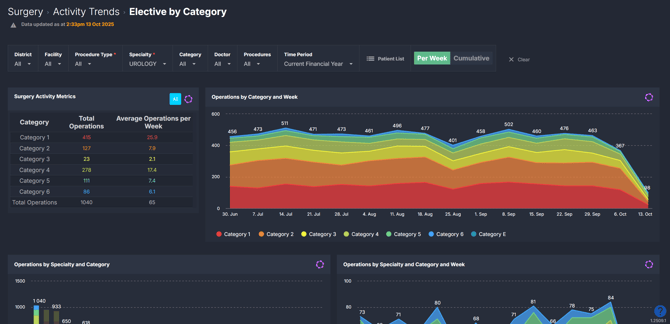
The Elective by Category component shows elective surgery activity over time, broken down by clinical priority and endoscopy categories. You can see how many cases were performed by each category and explore trends by specialty, doctor, and procedure. This helps you understand where elective workload is focused and how it changes week by week.
Why it matters
Understand where your elective surgical effort is focused and how it’s changing over time.
- Analyse elective surgery volumes and trends by specialty, doctor, and procedure.
- Identify which categories (including endoscopy) and procedures are driving your elective surgery workload.
- Support service planning, scheduling, and theatre capacity management.
- Compare activity across clinicians and specialties to spot workload variations.
How to use it
Filter to focus your view
You can explore data by applying filters in the filter bar or dynamically by clicking through charts as you scroll.
This makes it easy to move from hospital-level elective activity down to specialty, doctor, and procedure-level detail.
Filters include:
- Procedure Type: Filter by Surgical/Reportable, Non-surgical/Not Reportable and Endoscopy procedure types.
- Specialty: Drill down into a specific surgical specialty.
- Category: Focus on a specific surgical triage category.
- Doctor: Focus on a specific surgeon's activity.
- Procedures: Refine the view to specific operation codes.
- Time period: View your activity up to 12 months in the past.
Explore surgical activity trends
The charts in this component display the total number of elective operations performed within the selected time period, broken down by category, specialty, doctor, and procedure.
You can easily see how many category 1, 2, 3, and endoscopy cases were completed each week, and identify patterns in surgical activity across specialties or doctors.
You can also explore which doctors are performing the most operations within each category, or which procedures are being performed most often.
This makes it simple to see where your team’s effort is focused and how it changes over time — for example, if category 2 surgeries are increasing or if certain specialties or surgeons are completing higher numbers of urgent procedures.

💡 Tip: You can refine your filters as you scroll through the charts — each interaction updates the view below for deeper analysis.
Explore patient-level insights
Select the Patient List button to view all elective operations performed during the selected time period. This list shows each operation with details such as date, doctor, specialty, category, and procedure, ideal for a more detailed review.
This Patient List can be exported to Excel for reporting or analyse case mix, category distribution, or doctor-level activity and performance trends — see How to export in SystemView › for step-by-step instructions.
Toggle trend view
Use the Per Week / Cumulative button at the top of the component to switch between two different ways of looking at your data:
- Per Week: Shows weekly elective activity, helping you see rises or dips in surgical volume.
- Cumulative: Shows the total accumulation of operations over the selected timeframe.
How it works
This component brings uses historical data from your hospitals source system to create interactive visual trends of elective operations, grouped by category and endoscopy type.
You can click through the charts as you scroll to refine your view, starting from overall hospital performance and narrowing down to specialty, doctor, or procedure.
Every interaction dynamically updates the rest of the charts, allowing you to analyse where and how elective activity occurs without needing to reload or reset filters.
How it helps you
- Understand your elective workload: See which categories and specialties are performing the most surgeries.
- Compare clinician performance: Identify which doctors are completing the most cases within each category.
- Track trends over time: Monitor weekly and cumulative changes in elective activity.
- Explore procedures in detail: Understand which procedures make up the bulk of your elective and endoscopy workload.
- Plan smarter: Use historical elective trends to inform theatre allocation and staffing decisions.
Best practices
How often should I use it
| What to do | How often | Who should do it | Why it helps |
| Review weekly elective surgery activity by category | Weekly | Theatre Managers, Clinical Leads | Track fluctuations in elective workload |
| Analyse category mix by specialty and doctor | Monthly | Service Managers, Divisional Directors, Heads of Unit | Plan resources and scheduling based on case complexity |
| Monitor hospital-level trends | Monthly | Hospital Executives, Operations Managers | Identify shifts in elective demand or throughput |
| Export and review patient lists | As needed | Performance Teams, Data Analysts | Support audits, reporting, and detailed category and clinician analysis |
Pair with these components
- 🔗 Activity Trends > Elective & Emergency: Use together for a full picture of surgical activity, including emergency operations. Great for comparing elective and emergency workloads.
- 🔗 Elective Schedule Monitor: Plan upcoming theatre sessions using historical elective trends and category data to inform scheduling.
- 🔗 Theatre Effectiveness > Utilisation: Assess whether elective workloads align with theatre utilisation and session efficiency. Useful for balancing activity and capacity.
- 🔗 Waiting List > Risks & Projections: Review elective surgery performance alongside waiting list projections to anticipate demand and prioritise scheduling.
Tips for success
- Use both the filter bar and interactive charts to explore elective trends from hospital to procedure level.
- Toggle between Per Week and Cumulative to see weekly fluctuations versus long-term trends.
- Drill down by doctor or procedure to see who’s performing the most cases and which procedures are most common across categories.
- Export patient lists for category-level reporting and performance reviews.
- Pair this component with Elective & Emergency to understand how elective activity fits within total surgical demand.
Want a detailed breakdown?
If you’d like a more detailed look at every filter, chart, and tile in this component, you can download the Elective by Category Activity Trends End-User Guide below.
📎 Download: Activity Trends > Elective by Category Guide
❓FAQs / Troubleshooting
Q: Can I view all elective categories at once?
A: Yes — you can view combined Category 1, 2, 3, and endoscopy activity, or filter down to a single category.
Q: How can I compare activity between specialties or doctors?
A: Click directly on a specialty or doctor in the charts — the component will update dynamically to reflect your selection.
Q: When should I use the cumulative view?
A: Use the cumulative view to see the total volume of elective surgeries performed across your chosen timeframe — perfect for year-to-date summaries.