
Location in SystemView: SystemView > Explore > Beds > LoS Trends & Ward Dynamics
In this article:
- What it is
- Why it matters
- How to use it
- How it works
- How it helps you
- Best practices
- FAQs & Troubleshooting
What it is
This component provides a combined view of current and historical length of stay (LoS), admissions, discharges, and occupancy.
It helps you understand how ward and patient flow trends evolve over time, supporting operational planning and improvement discussions.
Why it matters
Spot emerging ward trends before they affect patient flow.
- Track changes in inpatient occupancy at midnight census.
- See the balance between daily admissions and discharges.
- Identify long-stay patient cohorts driving extended LoS.
- Compare ward-level vs total facility LoS to focus improvement.
- Support proactive bed management and discharge planning.
How to use it
Filter to focus your view
Use the filters to narrow analysis by:
- Division / Ward Type / Ward: Narrow results to specific divisions, ward types, or individual wards.
- Specialty / Doctor: Filter data by treating specialty or clinician.
- Age Cohort: Refine by patient age group.
- Admission / Discharge Type: Focus on internal vs external admissions and discharges.
- Timeframe: Adjust to review up to the past 18 months of data.
ℹ️ Note: Filter options may vary depending on your SystemView environment — some sites may display additional filters.
Explore length of stay and ward dynamics
The LoS Trends & Ward Dynamics component combines retrospective and current analysis of occupancy, admissions, and discharges, enabling daily and long-term review of inpatient patterns.
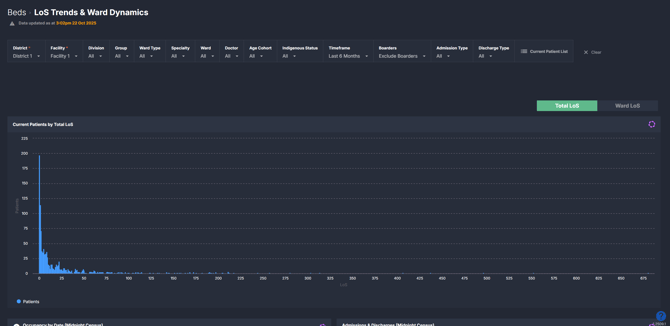
You can use the buttons at the top of the component to toggle between Total LoS and Ward LoS:
- Total LoS: Shows each patient’s total time in hospital, regardless of ward movement. This is useful for understanding the full journey.
- Ward LoS: Focuses on time spent within the selected ward only. This is ideal for identifying local efficiency or discharge delays.
Charts throughout the component provide a flowing view of patient flow and stay patterns:
- Current Patients by LoS shows how many patients are currently admitted, grouped by the number of days they have stayed.
- Occupancy by Date trends the number of open beds, occupied beds, and occupancy percentage for each day, providing an easy way to benchmark ward activity or review historical peaks.
- Admissions & Discharges Trend compares daily admissions and discharges, with a Net Admissions line to highlight surges or drops in demand.
- Average and Longest LoS by Date charts help identify variations in patient stay length and track changes as long-stay patients are discharged.
- Cohort LoS charts group patients into stay-length categories (for example 1–2 days, 3–5 days, 6–14 days, 15–30 days, or 30+ days) to help visualise where extended stays are concentrated.
💡 Tip: Each chart can be clicked to explore patient level details, or added to MyView ›, MyProjects › or a Hub Page › within Interact for ongoing monitoring and reporting.
Explore patient-level insights
For patient-specific analysis:
- Select the Current Patient List button at the top of the component to view all current inpatients and their length of stay.
Clicking on a point or trendline in any chart brings up a historical patient list for that day or group. For example:
- Click a point on the Admissions & Discharges chart to see who was admitted or discharged that day.
- Click a date on the Average or Longest LoS charts to review which patients contributed to that day’s metric.
- Click within a Cohort LoS chart to view both current and historical patients in that stay-length range.
This interactive analysis enables quick investigation into where and why longer stays occur, supporting discussions in bed meetings or performance reviews.
How it works
This component brings together historical and current inpatient activity so you can review occupancy, admissions, discharges, and length of stay patterns in one place. Use the filters to focus on your division, specialty, or ward, then switch between Total LoS and Ward LoS to change the lens of analysis.
How it helps you
- Identify patient flow patterns: Spot imbalances between admissions and discharges early.
- Understand occupancy dynamics: Track utilisation trends to inform staffing and resourcing.
- Focus improvement efforts: Pinpoint wards or cohorts with extended LoS.
- Drill into the detail: Access patient lists directly from any chart.
- Link insights to action: Add key charts to MyView, MyProjects or a Hub Page to monitor improvement over time.
Best practices
How often should I use it?
| What to Do | How Often | Who Should Do It | Why It Helps |
|---|---|---|---|
| Review occupancy and LoS trends | Daily |
Nurse Unit Managers, Bed Managers | Detect early signs of capacity pressure. |
| Analyse admission vs discharge balance | Weekly | Business Managers, Flow Coordinators | Inform resource and discharge planning. |
| Investigate long-stay cohorts | Fortnightly | Complex Care Teams, Improvement Leads | Target high length of stay drivers. |
| Benchmark ward activity | Monthly | Executives, Service Planners | Track performance and identify systemic issues. |
Pair with these components and features
- 🔗 Bed Capacity Monitor: Review and adjust current vs available beds alongside length of stay trends.
- 🔗 Complex Patients > Complex Patients Register: Explore whether long-stay trends relate to complex discharge cases.
- 🔗 Inpatient Flow Monitor > Hospital Overview: Compare daily occupancy and flow at hospital level.
- Risk of Hospitalisation > Readmission Trends: Identify if longer stays correlate with readmission risk.
- 🔗 MyProjects and 🔗 MyHub: Add key LoS charts to a project or hub page dashboard to track improvement initiatives, monitor specific wards, or share live occupancy insights with your broader team.
Tips for success
- Use the filters to drill down to your specific division, specialty, or ward to see trends most relevant to your area.
- Use the Total LoS / Ward LoS toggle to shift between whole-journey and patients current ward length of stay analysis.
- Click directly on charts to open patient lists for any selected day or cohort.
- Use the Timeframe filter to view up to 18 months of data.
- Add key charts to MyView, MyProjects, or MyHub to track progress, create ward dashboards, or share insights with your team.
Want a detailed breakdown?
If you’d like a more detailed look at every filter, chart, and tile in this component, you can download the LoS Trends & Ward Dynamics Guide below.
📎 Download: Beds > LoS Trends & Ward Dynamics Guide
❓FAQs & Troubleshooting
Q. What is the difference between Total LoS and Ward LoS
A. Total LoS reflects the full hospital stay from admission to the selected date. Ward LoS reflects only the time spent in the selected ward. Use Total LoS for whole of journey analysis and Ward LoS to identify ward level delays or flow issues.
Q. What is the difference between Hospital and Ward admission types?
A. Use the Admission Type filter to adjust what you see in the charts:
- Hospital: Includes all new hospital admissions.
- Ward: Includes only ward transfers within the hospital.
Q. What is the difference between Home and Hospital discharge types?
A. Use the Discharge Type filter to refine the discharges displayed:
- Home: Shows all discharges outside of the hospital, such as to home, aged care, rehabilitation, or respite facilities.
- Ward: Shows discharges that are internal transfers between wards.
Q. Can I get a list of patients for a specific day
A. Yes. Click a point on the Admissions and Discharges trend to open the patient list for that date. You can also click a point on Average LoS or Longest LoS to see the patients who contributed to that value.
Q. How do I see all current inpatients for my area
A. Use the Patient List button above the Current Patients by LoS chart. Apply filters first to focus on your division, specialty, or ward.