
Location in SystemView: SystemView > Explore > Beds > Ward View > Ward Overview
In this article:
- What it is
- Why it matters
- How to use it
- How it works
- How it helps you
- Best practices
- FAQs & Troubleshooting
What it is
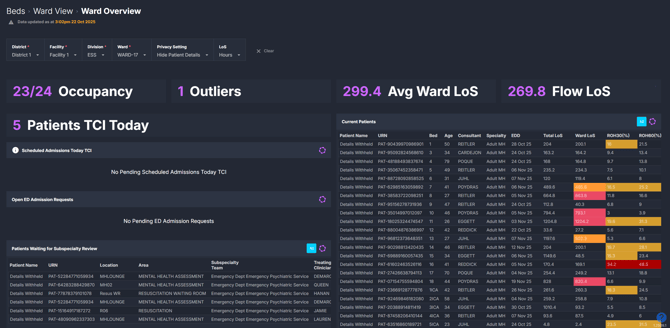
The Ward Overview component provides a near real-time view of activity on a selected ward. It displays key metrics such as occupancy, outliers, average length of stay (LoS), and flow LoS, alongside patient-level lists for current inpatients, upcoming scheduled admissions, emergency requests, and subspecialty reviews.
This component helps nurse unit managers and ward teams manage their current capacity while anticipating incoming demand from the Emergency Department (ED) and scheduled admissions.
Why it matters
Stay one step ahead of daily ward flow.
- Quickly see your current occupancy and any outlier patients.
- Identify long-stay or at-risk patients through SystemView's Flow Length of Stay and Risk of Hospitalisation flags.
- Anticipate demand from today’s and tomorrow’s scheduled admissions.
- Gain early visibility of potential admissions from ED or subspecialty reviews.
How to use it
Filter to focus your view
When you click into the Ward Overview component, you’ll first need to apply your Facility / Hospital, Division, and Ward filters to open the view.
Once your ward is selected, you can refine your view further using:
- LoS: Toggle between displaying your length of stay metrics as hours or days depending on the type of ward.
- Privacy Settings: Choose whether to display or hide patient details when using the component in shared clinical spaces.
Explore your ward snapshot
When opened, the Ward Overview shows a snapshot of your selected ward’s current state:
- Occupancy: the proportion of ward beds currently occupied.
- Outliers: number of patients under your ward’s specialty who are admitted elsewhere.
- Average Ward LoS: average stay length for current inpatients (displayed in hours or days).
- Flow LoS: the target stay length calculated by SystemView’s algorithm to maintain patient flow.
Below the key metrics, several live patient lists provide detailed insights:
- Current Patients: Shows all inpatients on your ward, including bed number, specialty, consultant, estimated discharge date, and LoS flags. Patients breaching or at risk of breaching Flow LoS are highlighted in red and orange.
- Scheduled Admissions Today/Tomorrow: Lists patients expected to arrive via planned admission pathways for today and the next day.
- Open ED Admission Requests: Shows patients in the ED who have a bed request for your ward, including wait times and treating clinician.
- Patients Awaiting Subspecialty Review: Displays ED patients waiting for review from your ward’s specialty, helpful for anticipating likely upcoming admissions.
- Outliers List: Identifies patients who should belong to your ward’s specialty but are currently accommodated in another ward.
💡 Tip: You can display this component on shared coordination screens by hiding patient details in Privacy Settings.
How it works
The Ward Overview component aggregates real-time data from your hospital source systems to present a concise operational picture of the ward. It enables proactive planning by showing both current occupancy and near-term demand from ED and scheduled admissions.
Calculation logic
- Flow Length of Stay (LoS): SystemView’s Flow LoS algorithm analyses current demand, capacity, and historical discharge trends to estimate an ideal length of stay that sustains optimal flow. Patients Flow LoS category is colour coded in the patient list ward LoS column:
- 🔴 Red = Passive Bed: Patient with a ward LoS at or more than double the Flow LoS.
- 🔶 Orange = Passive Bed Risk: Patient with a ward LoS above but less than double the Flow LoS.
- 🔵 Blue = Below Flow LoS: Patient with a ward LoS below the Flow LoS target.
🔗 Learn more about Flow LoS ›
- Risk of Hospitalisation (RoH): Displayed as a percentage indicating the likelihood that a discharged patient will be readmitted within 30 or 60 days. Patients are colour coded based on their RoH in the patient lists:
- 🔴 Red = High risk of rehospitalisation
- 🌕 Yellow = Medium risk of rehospitalisation
🔗 Learn more about RoH ›
- Outlier: An inpatient under the care of your ward’s specialty but physically admitted to a different ward.
How it helps you
- Stay informed: Instantly see your current occupancy and patient movement.
- Manage proactively: Plan for scheduled and potential admissions before they arrive.
- Monitor long stays: Use Flow LoS flags to identify patients at risk of breach.
- Support safe discharge: Consult RoH percentages in ward round discussions.
- Coordinate teams: Use live lists to inform nurse handover and bed management meetings.
Best practices
How often should I use it?
| What to do | How often | Who should do it | Why it helps |
| Review occupancy and outlier counts | Start of each shift | Nurse Unit Managers, Bed Coordinators | Keeps staff aware of current capacity. |
| Check ED requests and subspecialty reviews | Throughout the day | Flow Coordinators, Team Leads | Anticipate incoming patients before admission. |
| Monitor long-stay flags (red/orange) | Daily | Nurse Unit Managers, Ward Clinicians, Allied Health Staff | Supports timely discharge planning. |
| Review scheduled admissions for tomorrow | End of shit | Nurse Unit Managers, Ward Clerks | Enables resource and staff planning. |
Pair with these components
- 🔗 Bed Capacity Monitor: Adjust bed availability and see immediate impact on occupancy metrics.
- 🔗 Inpatient Flow Monitor > Hospital Overview: Understand how your ward fits within total hospital flow.
- 🔗 Ward View > Ward Demand: Forecast upcoming ward admissions and demand pressure to plan ahead for patient flow and staffing.
- 🔗 LoS Trends & Ward Dynamics: Compare current ward performance to historical stay patterns and Flow LoS expectations.
- 🔗 Discharge Trends: Identify discharge delays and plan for upcoming patient turnover.
- 🔗 ED > Department Now > Subspecialty Reviews: Anticipate admissions linked to your ward’s specialty for improved coordination.
💡 Tip: The Ward Overview is ideal for building MyHub dashboards, combining tiles and patient lists from Beds and ED components to create a live snapshot of ward activity tailored to your role. See more about how to create a MyHub page ›
Tips for success
- Toggle LoS Units between hours and days to suit short- or long-stay wards.
- Use Privacy Settings when displaying the dashboard in shared areas.
- Monitor Flow LoS flags (orange/red) to identify patients needing review.
- Review Scheduled Admissions Tomorrow daily to prepare resources.
- Add Ward Overview tiles to your MyHub dashboards alongside related Beds and ED components for a one-stop view of occupancy, demand, and discharge planning.
Want a detailed breakdown?
If you’d like a more detailed look at every filter, chart, and tile in this component, you can download the Ward Overview Guide below.
📎 Download: Ward View > Ward Overview Guide
❓FAQs & Troubleshooting
Q. What’s the difference between Ward LoS and Flow LoS?
A. Ward LoS shows actual average stay duration for current inpatients. Flow LoS is the ideal target SystemView calculates to maintain patient flow and bed availability.
Q. What does ‘Outlier’ mean in this component?
A. An outlier is a patient under your ward’s specialty but physically located on another ward due to capacity or clinical reasons.
Q. Why would I switch between hours and days for length of stay?
A. Different wards manage patients on very different timeframes. Short-stay or same-day units (like MDUs or MAUs) benefit from viewing LoS in hours to track turnover within a single day. In contrast, inpatient or rehab wards gain more insight viewing LoS in days, where patients remain longer.
Use the LoS filter to choose the view that best matches your ward’s operational rhythm.