
Location in SystemView: SystemView > Explore > Outpatients > Clinic Effectiveness > Conversions to Elective Surgery
In this article:
- What it is
- Why it matters
- How to use it
- How it works
- How it helps you
- Best practices
- FAQs / Troubleshooting
What it is
The Conversions to Elective Surgery component highlights the proportion of productive outpatient appointments that result in patients being referred for elective surgery and shows how these vary across clinics, doctors, and time, helping teams understand how outpatient activity contributes to the elective surgery waitlist.
Why it matters
See where and when outpatient appointments are leading to elective surgery referrals.
- Identify clinics and doctors referring the most patients for elective surgery.
- Understand how outpatient activity contributes to surgical demand.
- Monitor long-term referral patterns to support planning and theatre scheduling.
- Use patient-level data to validate and report referral outcomes.
How to use it
Filter to focus your view
Use filters to narrow your analysis to specific services or clinics:
- Specialty: Focus on a specific clinical specialty or service.
- Doctor: View conversions to elective surgery by a specific doctor or resource.
- Clinic Code: Narrow your view to a single clinic.
- Appointment Type: Filter by new or review appointments.
- Appointment Mode: Distinguish between in-person, phone, telehealth, or other modes.
- Days of Week: View data for selected clinic days.
- Appointment Time Slots: Narrow to specific times of day or session slots.
Explore elective surgery referral trends and clinic activity
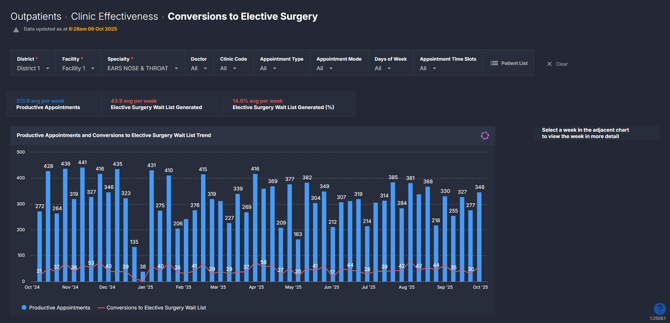
The first page provides a high-level overview of conversions to elective surgery across your selected filters.
| Tile name | What is shows |
| Summary Tiles | Snapshot of average weekly elective surgery referrals, referral rate, and productive appointments. |
| Productive Appointments and Conversions to Surgery Trend | 12-month trend of total appointments with the proportion of those added to the elective surgery waitlist over. |
💡Tip: Add these to a MyHub › alongside other Clinic Effectiveness components tiles and charts to see how outpatient activity translates into elective surgery demand.
Dive deeper into a selected week
Click into a week to explore conversions to elective surgery patterns in more detail.
| Chart name | What it shows |
| Productive Appointments and Conversions to Surgery by Doctor | Breakdown of total productive appointments and surgery referrals by each doctor for the selected week. |
| Productive Appointment Schedule | Visual schedule of appointment distribution and when referrals to surgery occurred by day and time. |
| Productive Appointments and Conversions to Surgery by Clinic | Comparison of appointment and surgery referral activity across clinics. *Only appears when you select a day and time slot on the Discharge Appointment Schedule. |
| Productive Appointments by Result | Displays the outcomes of productive appointments over the previous 52 weeks and the percentage of each outcome. |
| Productive Appointments and Discharges Trend | Weekly trendline for productive appointments and surgery referral rates for the selected day and time slot (e.g., if you click Tuesday AM, it will show the last 12 months of Tuesday morning appointments and conversions to surgery). |
To return to the main overview, click Clear filters and return at the top of the component.
💡 Tip: Appointments by Clinic, Surgery Trend, and Appointments by Results charts only display after selecting a specific day and time slot on the Productive Appointment Schedule.
Explore patient-level insights
Click on the Patient List at the top of the component to explore appointment-level detail for the past 12 months or the selected week.
This list mirrors the one in New & Review Appointments ›, showing all productive appointments with an Appointment Result column - in this component, conversions to elective surgery are highlighted in red. A final column also shows how many review appointments the patient has had in the selected specialty over the past 2 years.
It’s useful for comparing the volume of appointments that have resulted in the patient being added to the elective surgery waitlist against those that resulted in a review appointment or analysing how many reviews patients typically have before being referred for surgery. You can export the list to Excel for reporting or analysis. See How do I export charts and tables.
How it works
The component analyses productive outpatient appointments where the recorded outcome is Referred for Elective Surgery. Data updates daily and reflects entries made in the hospital’s source system.
Calculation logic
- Added to surgery waitlist rate = (Number of appointments resulting in elective surgery referral ÷ Total attended appointments) × 100
-
Productive appointments = Appointments attended and completed (excluding DNAs and cancellations).
How it helps you
- Forecast surgical demand: Understand how outpatient appointments generate elective surgery referrals.
- Monitor patterns: Identify specialties or clinics referring higher numbers of patients.
- Support planning: Align outpatient capacity with downstream surgical demand.
- Validate data accuracy: Ensure elective surgery referrals are coded correctly.
- Improve visibility: Track how outpatient activity feeds into theatre and waitlist management.
Best practices
How often should I use it
| What to do | How often | Who should do it | Why it helps |
| Review surgery referral rates | Weekly | Clinic Managers, Admin Teams | Track surgical demand generated from clinics. |
| Drill into specific doctor or clinic | As needed | Service Leads, Surgical Planners | Identify areas creating significant theatre workload. |
| Export patient list for audits | Monthly | Admin or Data Teams | Support validation and forecasting of surgical activity. |
Pair with these components
- 🔗 Clinic Effectiveness > Discharges: Compare discharge and surgery referral patterns to understand patient flow and care outcomes.
- 🔗 Clinic Effectiveness > New & Review Appointments: See how appointment types influence surgery referral likelihood.
- 🔗 Clinic Effectiveness > FTA / DNA Trends: Assess whether non-attendance patterns affect surgery referral opportunities.
- 🔗 Interact > MyHub: Combine surgery referral metrics with other components to build a complete view of outpatient and surgical demand. See How to create a MyHub › for instructions.
Tips for success
- Filter by specialty: Focus on services generating high elective surgery referrals.
- Check data entry accuracy: Referral outcomes rely on appointments being inputted as Referred for Elective Surgery in the hospital’s source system.
- Use the patient list for audits: Identify trends or validate referral data for service planning.
- Export regularly: Compare referral data against elective surgery waitlists for planning insights.
Want a detailed breakdown?
If you’d like a more detailed look at every filter, chart, and tile in this component, you can download the Conversions to Elective Surgery Guide below.
📎 Download: Clinic Effectiveness > Conversions to Elective Surgery Guide
❓FAQs / Troubleshooting
Q. Why aren’t any conversions to elective surgery appearing?
A. Check your filters and confirm that appointing resulting in an elective surgery referral are being recorded in your hospital’s source system. If you believe referrals are occurring but none appear, it may be a data entry issue - SystemView relies on appointments being correctly captured as Referred for Elective Surgery.
Q. How do I return to the overview if I clicked onto a week?
A. Click Clear filters and return at the top of the component to go back to the main page.
Q. Can I export referral data?
A. Yes — click the Patient List button and export the data to Excel for deeper analysis or validation.